Prefer to watch? This short video walks you through the Price Timeline.
Pricefy records the competitor price history and the stock history of every URL it tracks, and shows them on the Price Timeline: how a rival’s price moved over days and weeks, how it compares to yours, and when the product went out of stock or came back. It’s easy to miss — it lives behind a small chart icon on the Monitored URLs page.
Open a competitor’s price history
- In the sidebar, go to Competitors → Monitored URLs.
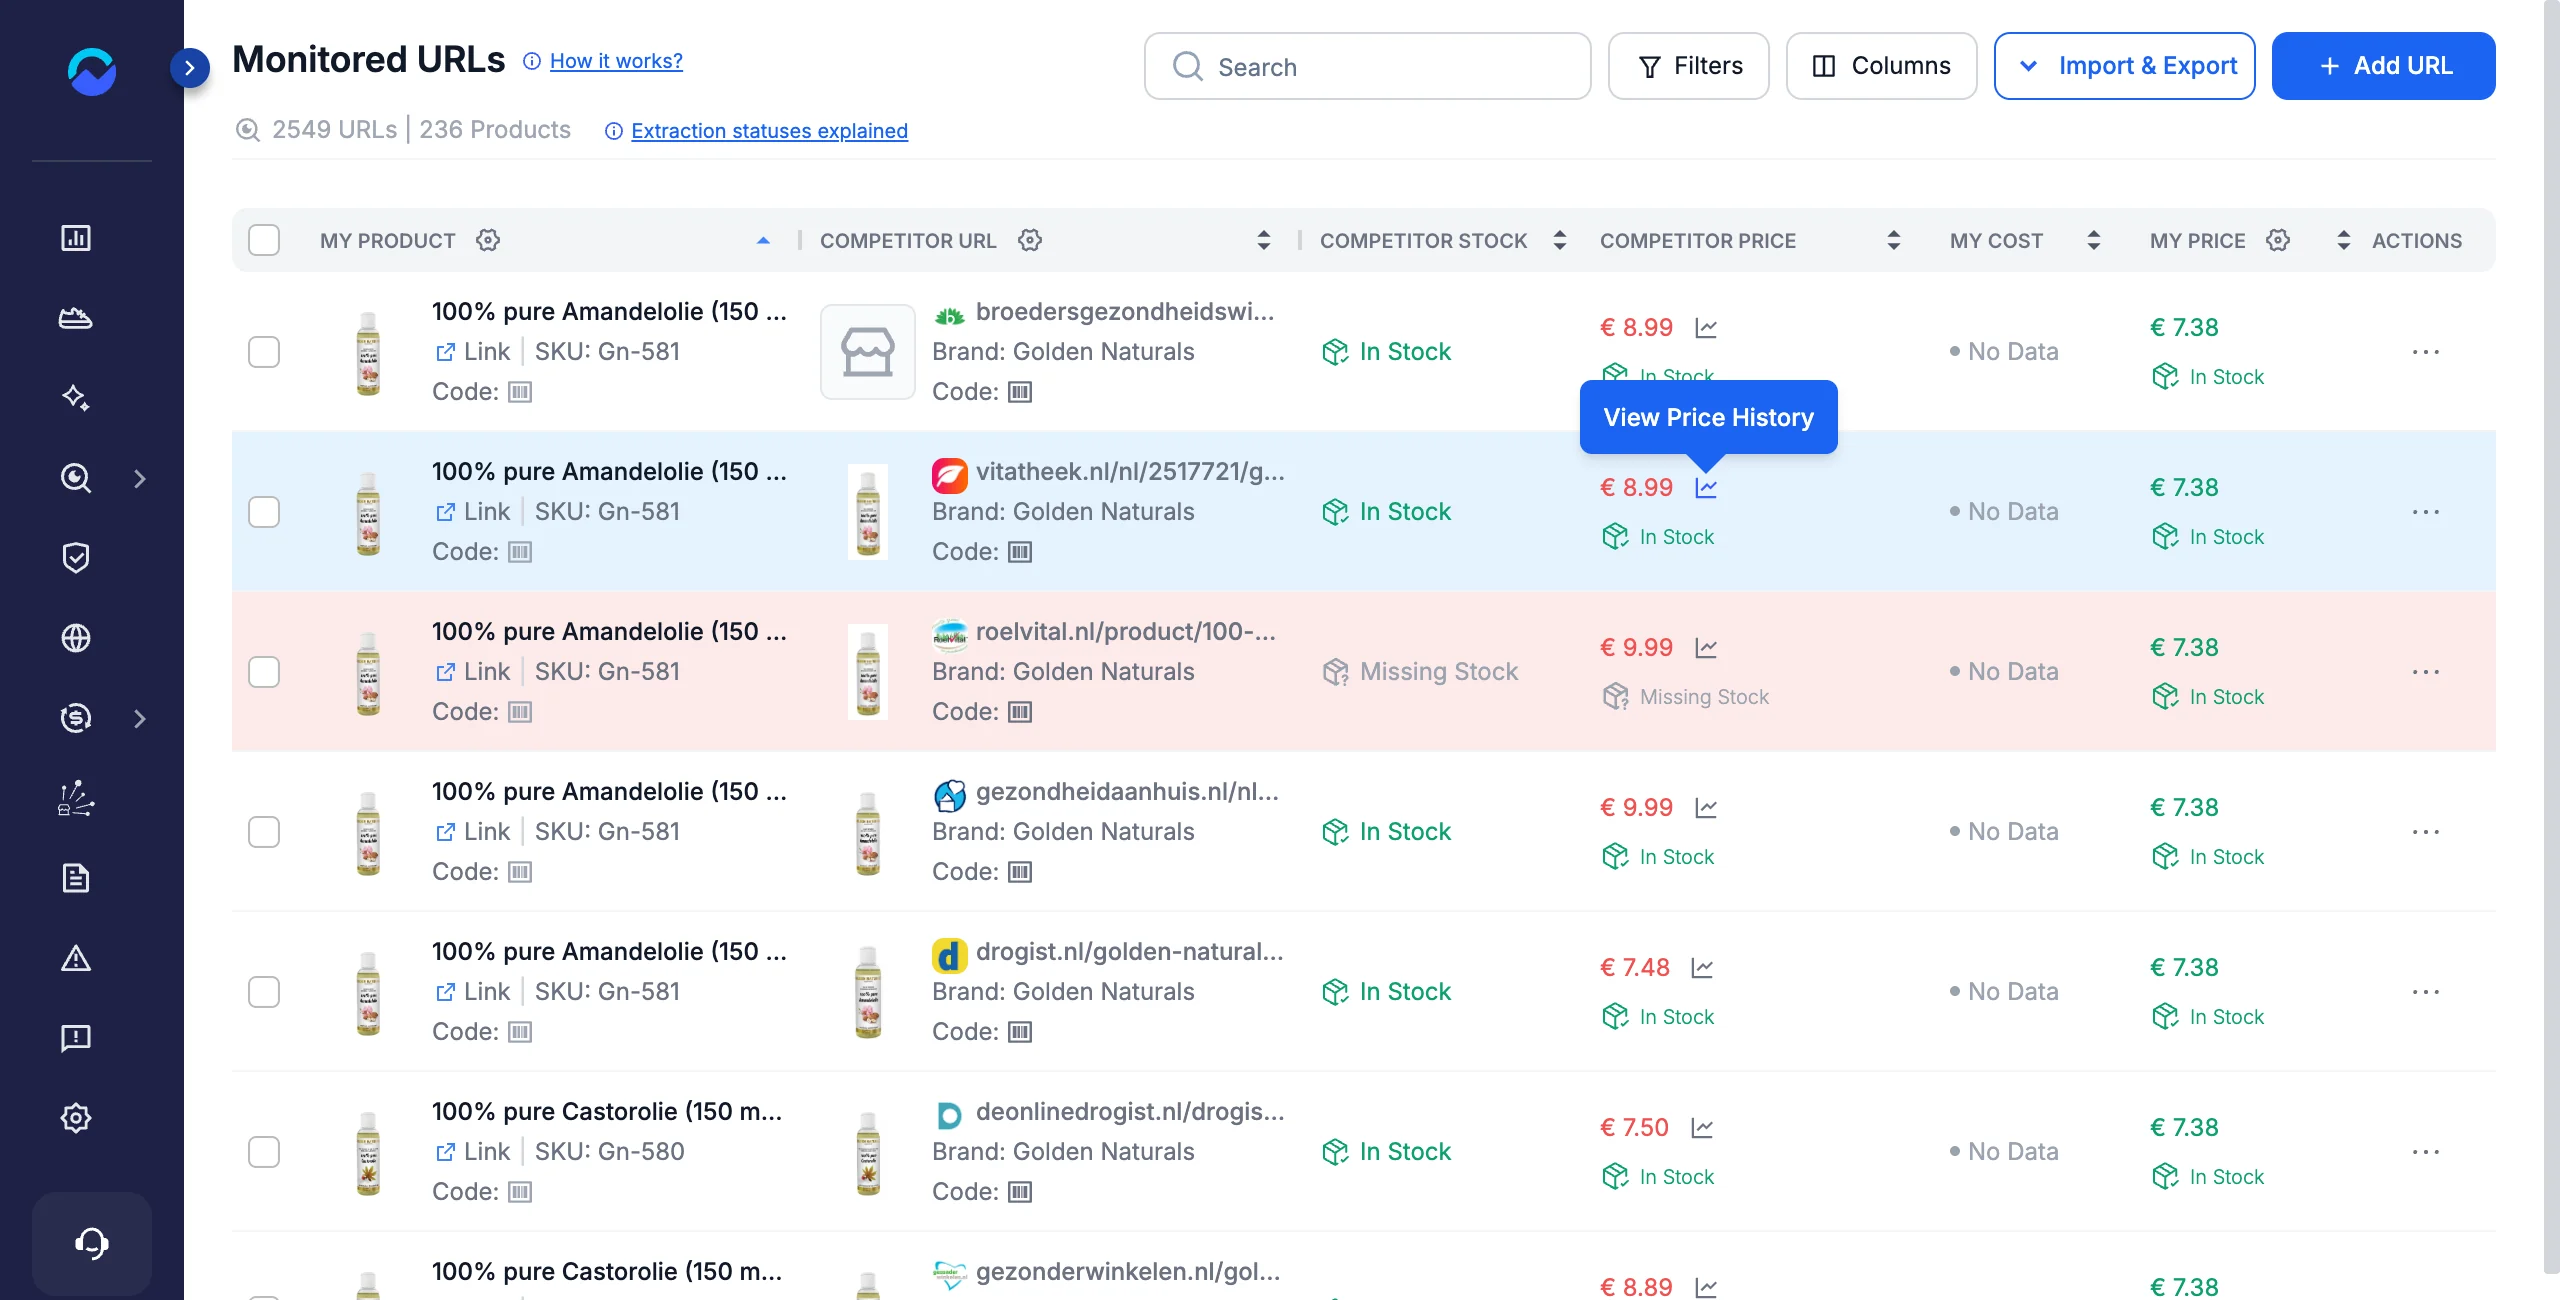
- Find the product and competitor you want. In the Competitor Price column, click the small line-chart icon next to the price — hover it and it reads View Price History.
The icon sits right next to each competitor’s price:
This opens the Price Timeline for that product at that competitor.
Read the Price Timeline
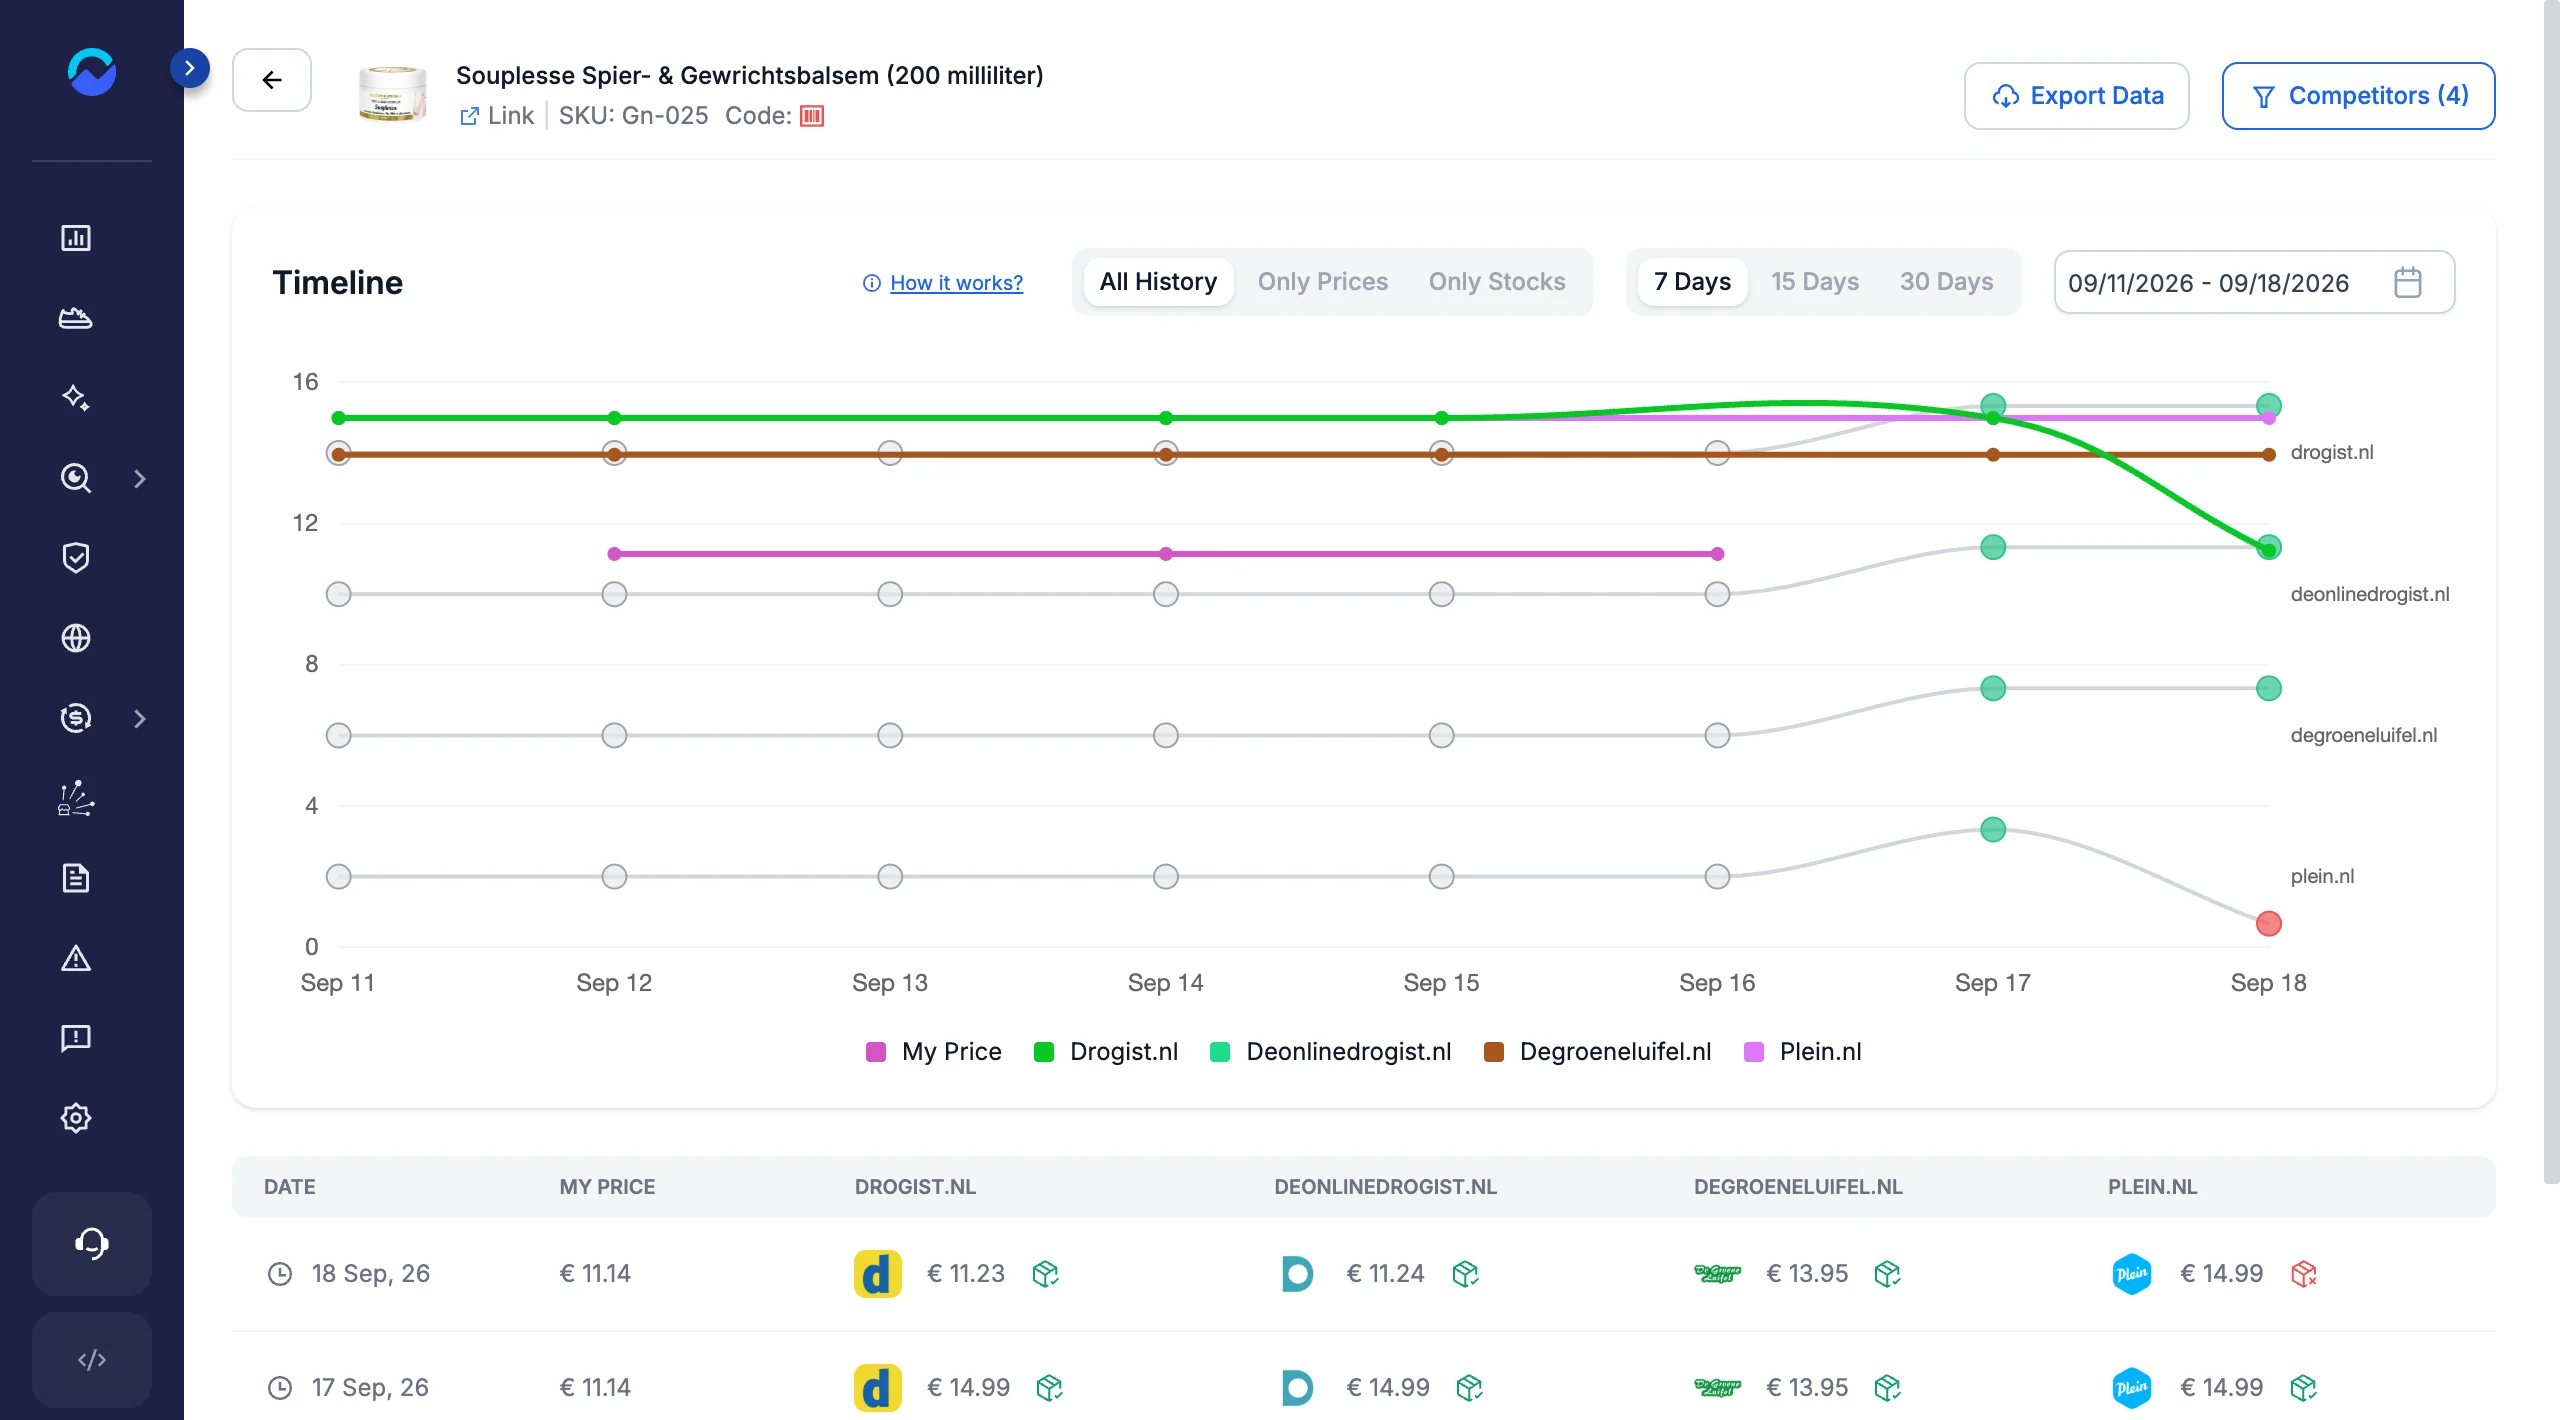
The chart puts prices and stock on the same timeline:
- Price lines — your price (My Price) and each competitor’s price, one coloured line each. The legend under the chart names them.
- Stock lines — one grey lane per competitor, named at the side of the chart. Each day has a dot that moves up or down with the stock.
The colour of each dot shows that day’s stock:
- Green (up) — in stock.
- Red (down) — out of stock.
- Dark grey — page removed: the competitor’s page no longer exists.
- Light grey — no stock data for that day.
Here plein.nl goes out of stock on the last day, while drogist.nl drops its price:
Hover any day to see every price and stock state in one tooltip — how long each stock state has lasted, and any change detected that day, such as Out of stock (detected on this day):
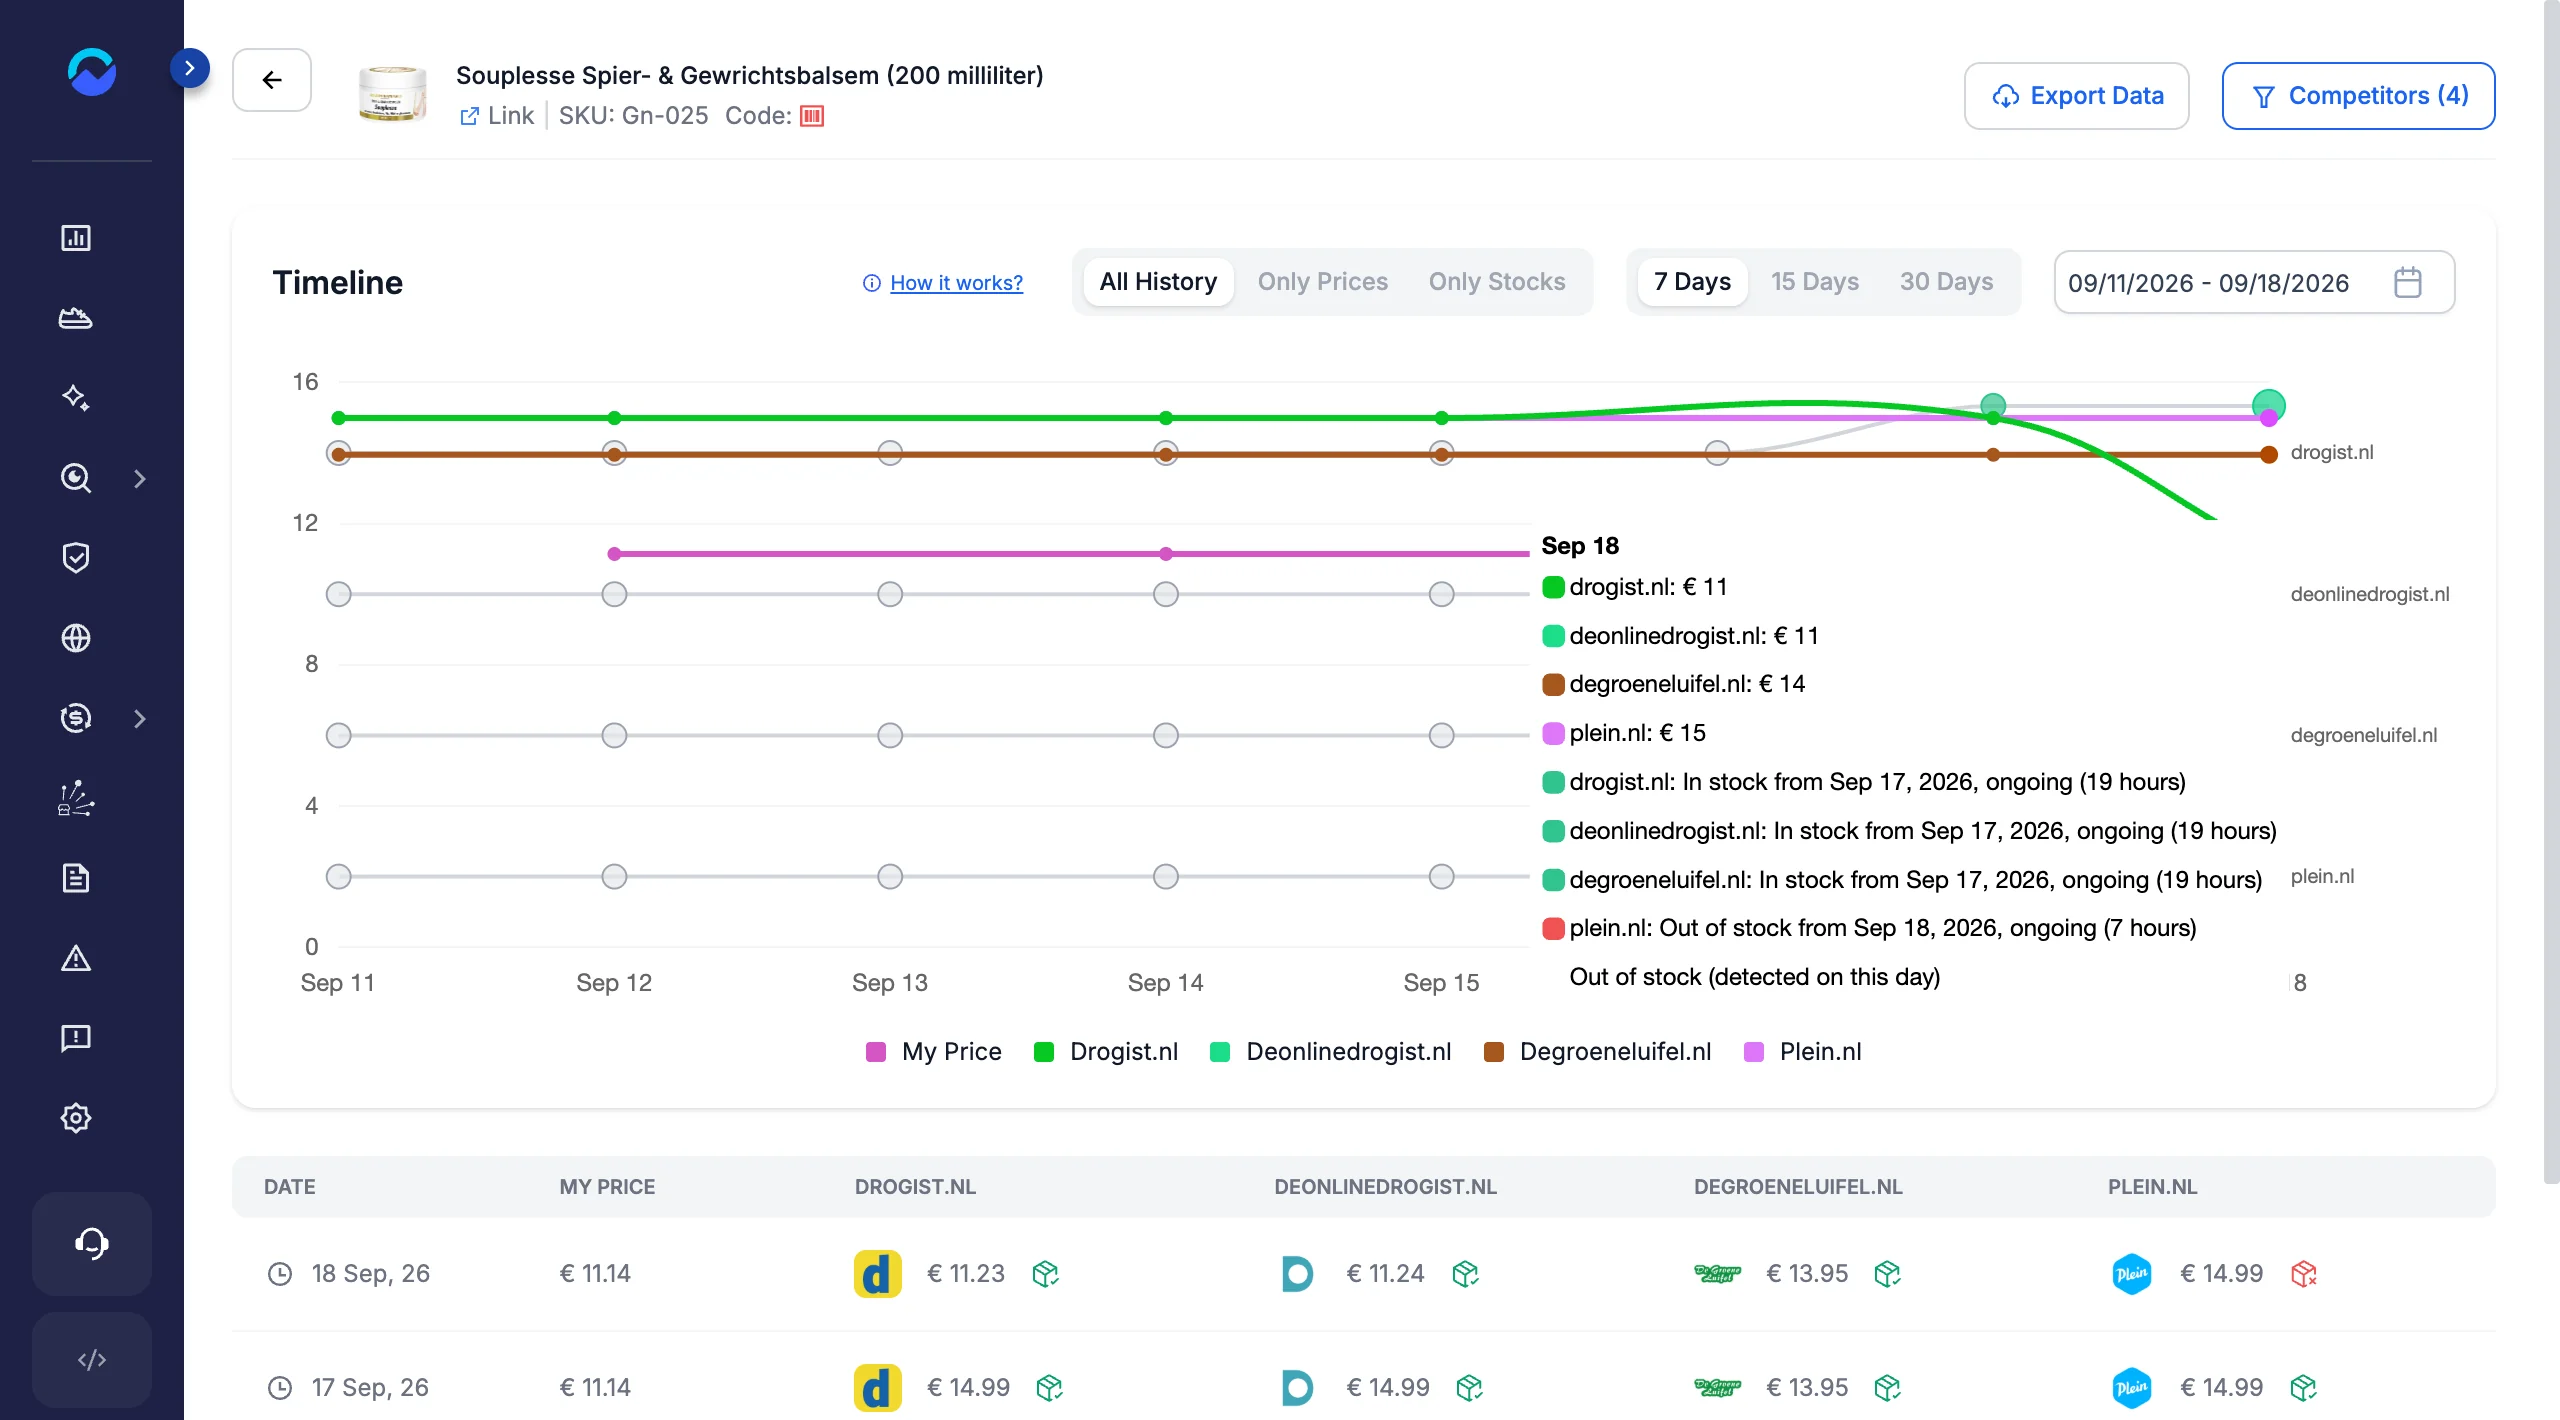
Below the chart, a table lists every date with My Price, each competitor’s price, and how much higher or lower it is than yours (with the percentage). An icon next to each price shows that day’s stock — hover it for the state. Days without a price reading show Missing Price.
Show only prices or only stock
Use the switch above the chart to choose what it shows:
- All History — prices and stock together (the default).
- Only Prices — just the price lines, for a cleaner price comparison.
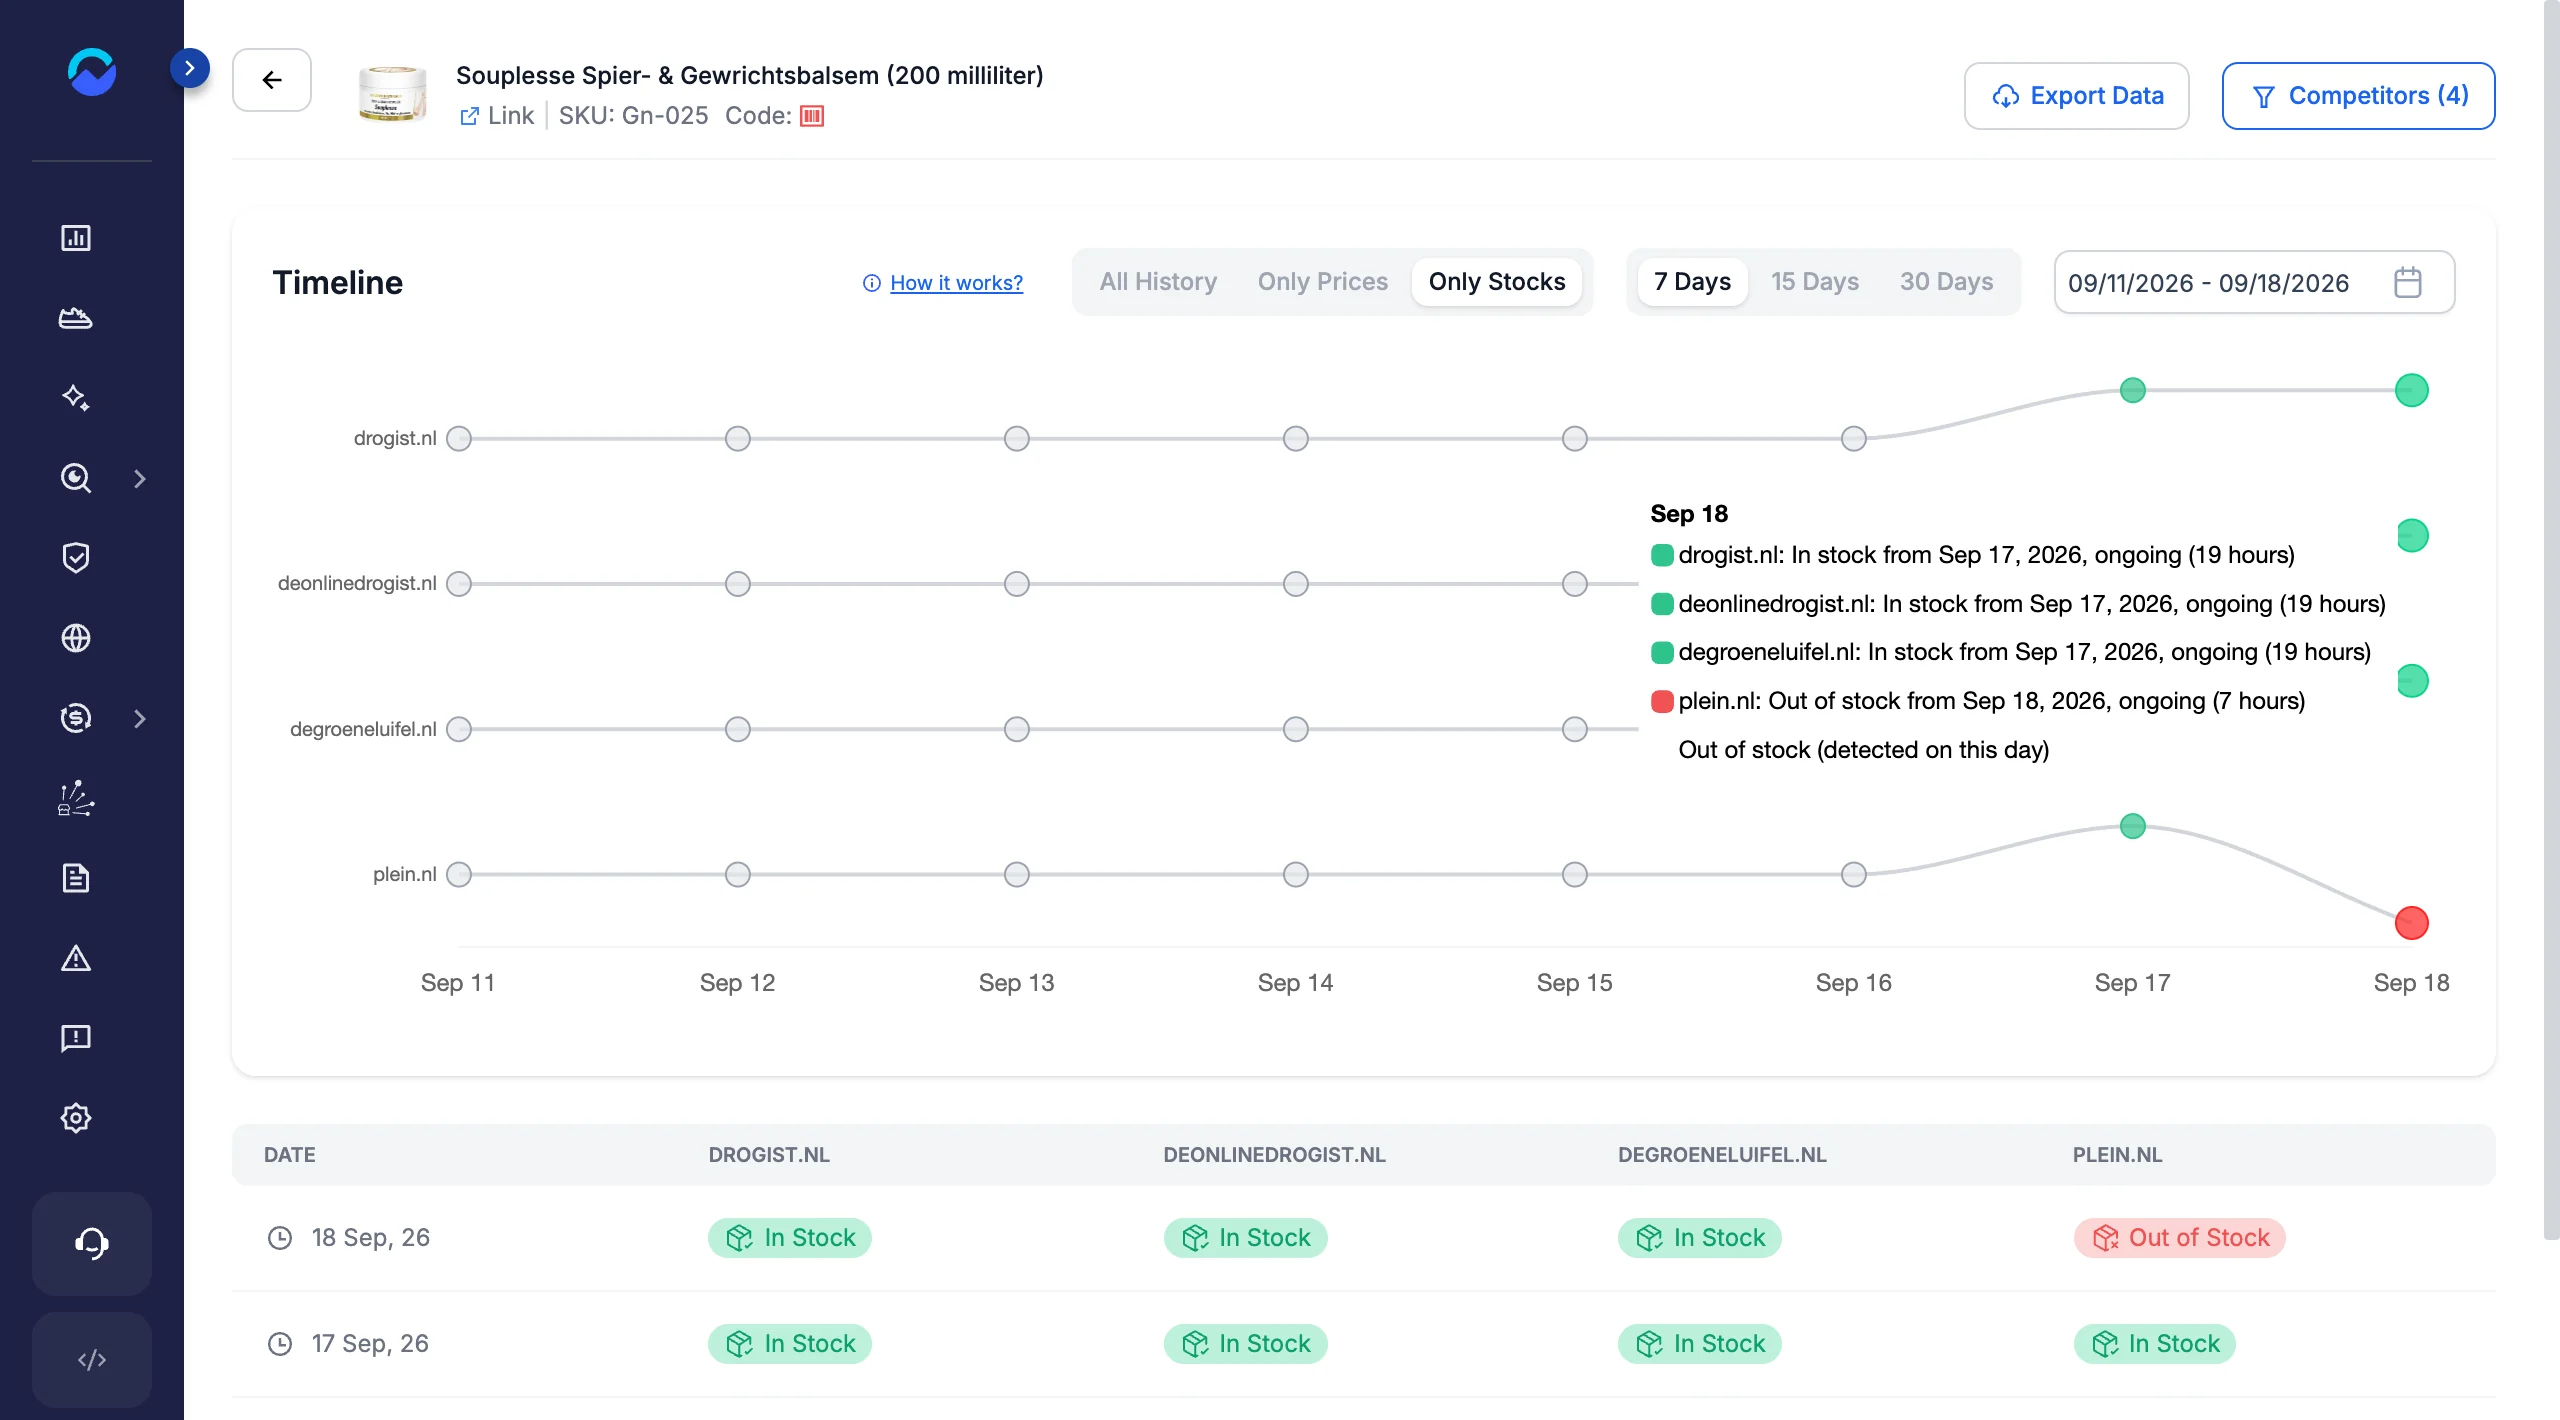
- Only Stocks — just the stock lanes. The table then shows a labelled badge per competitor and day (In Stock, Out of Stock, Page Removed or Missing Stock) and leaves out your price.
Only Stocks is the quickest way to spot when a rival ran out of stock:
Change the time range
Pick how far back to look:
- Use the 7 Days / 15 Days / 30 Days toggle for quick ranges.
- Or choose a custom range with the date picker, up to six months at a time.
Prices are kept for about the last 60 days, and stock for 6 months. When you pick a range that goes further back, a note under the chart reminds you — the stock history is still available through the export.
Compare several competitors on one chart
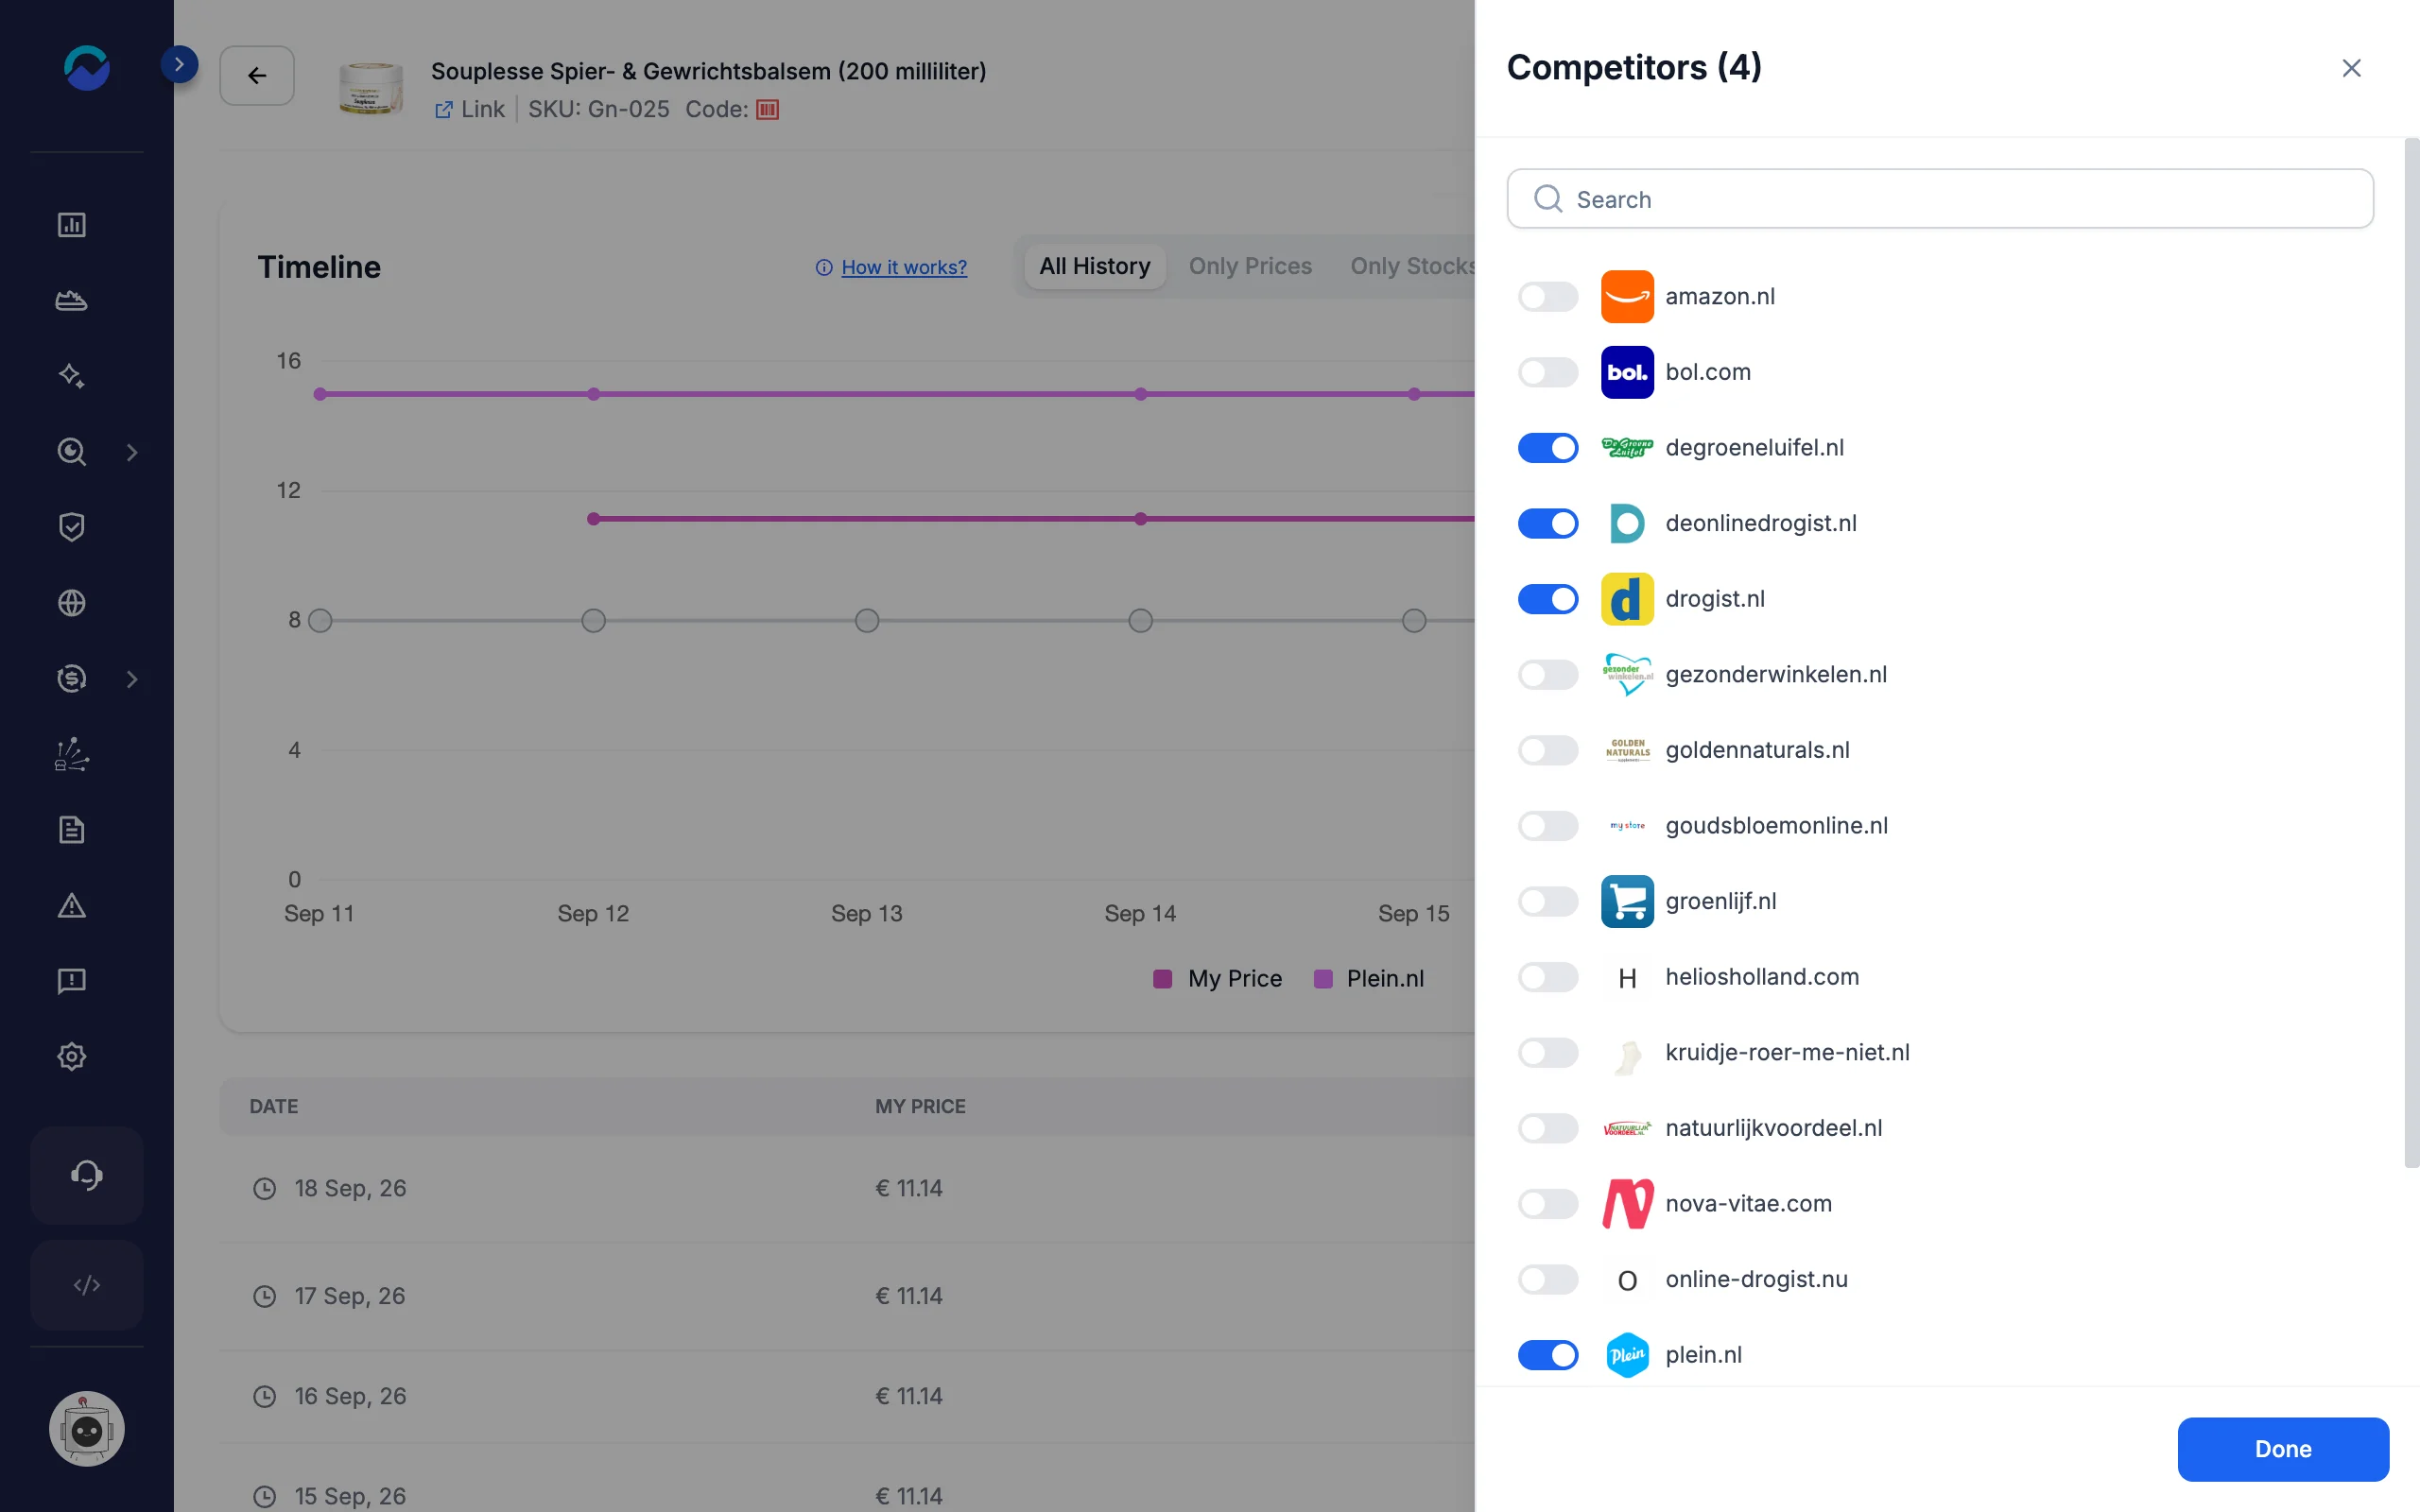
- Click Competitors (N) at the top right — it lists every competitor that tracks this product, with a search box.
- Toggle on the ones you want to see, then click Done. At least one competitor must stay selected.
Each competitor gets its own price line and stock lane, so you can compare rivals side by side:
Prices include your price adjustments
If a competitor’s prices are adjusted — on its profile or on the URL — the timeline shows every day recalculated with the adjustments as they are today, so old and new prices stay comparable. Hover a competitor price in the table to see which adjustments apply. Learn more in How to use Price Adjustment.
Export this product’s price or stock history
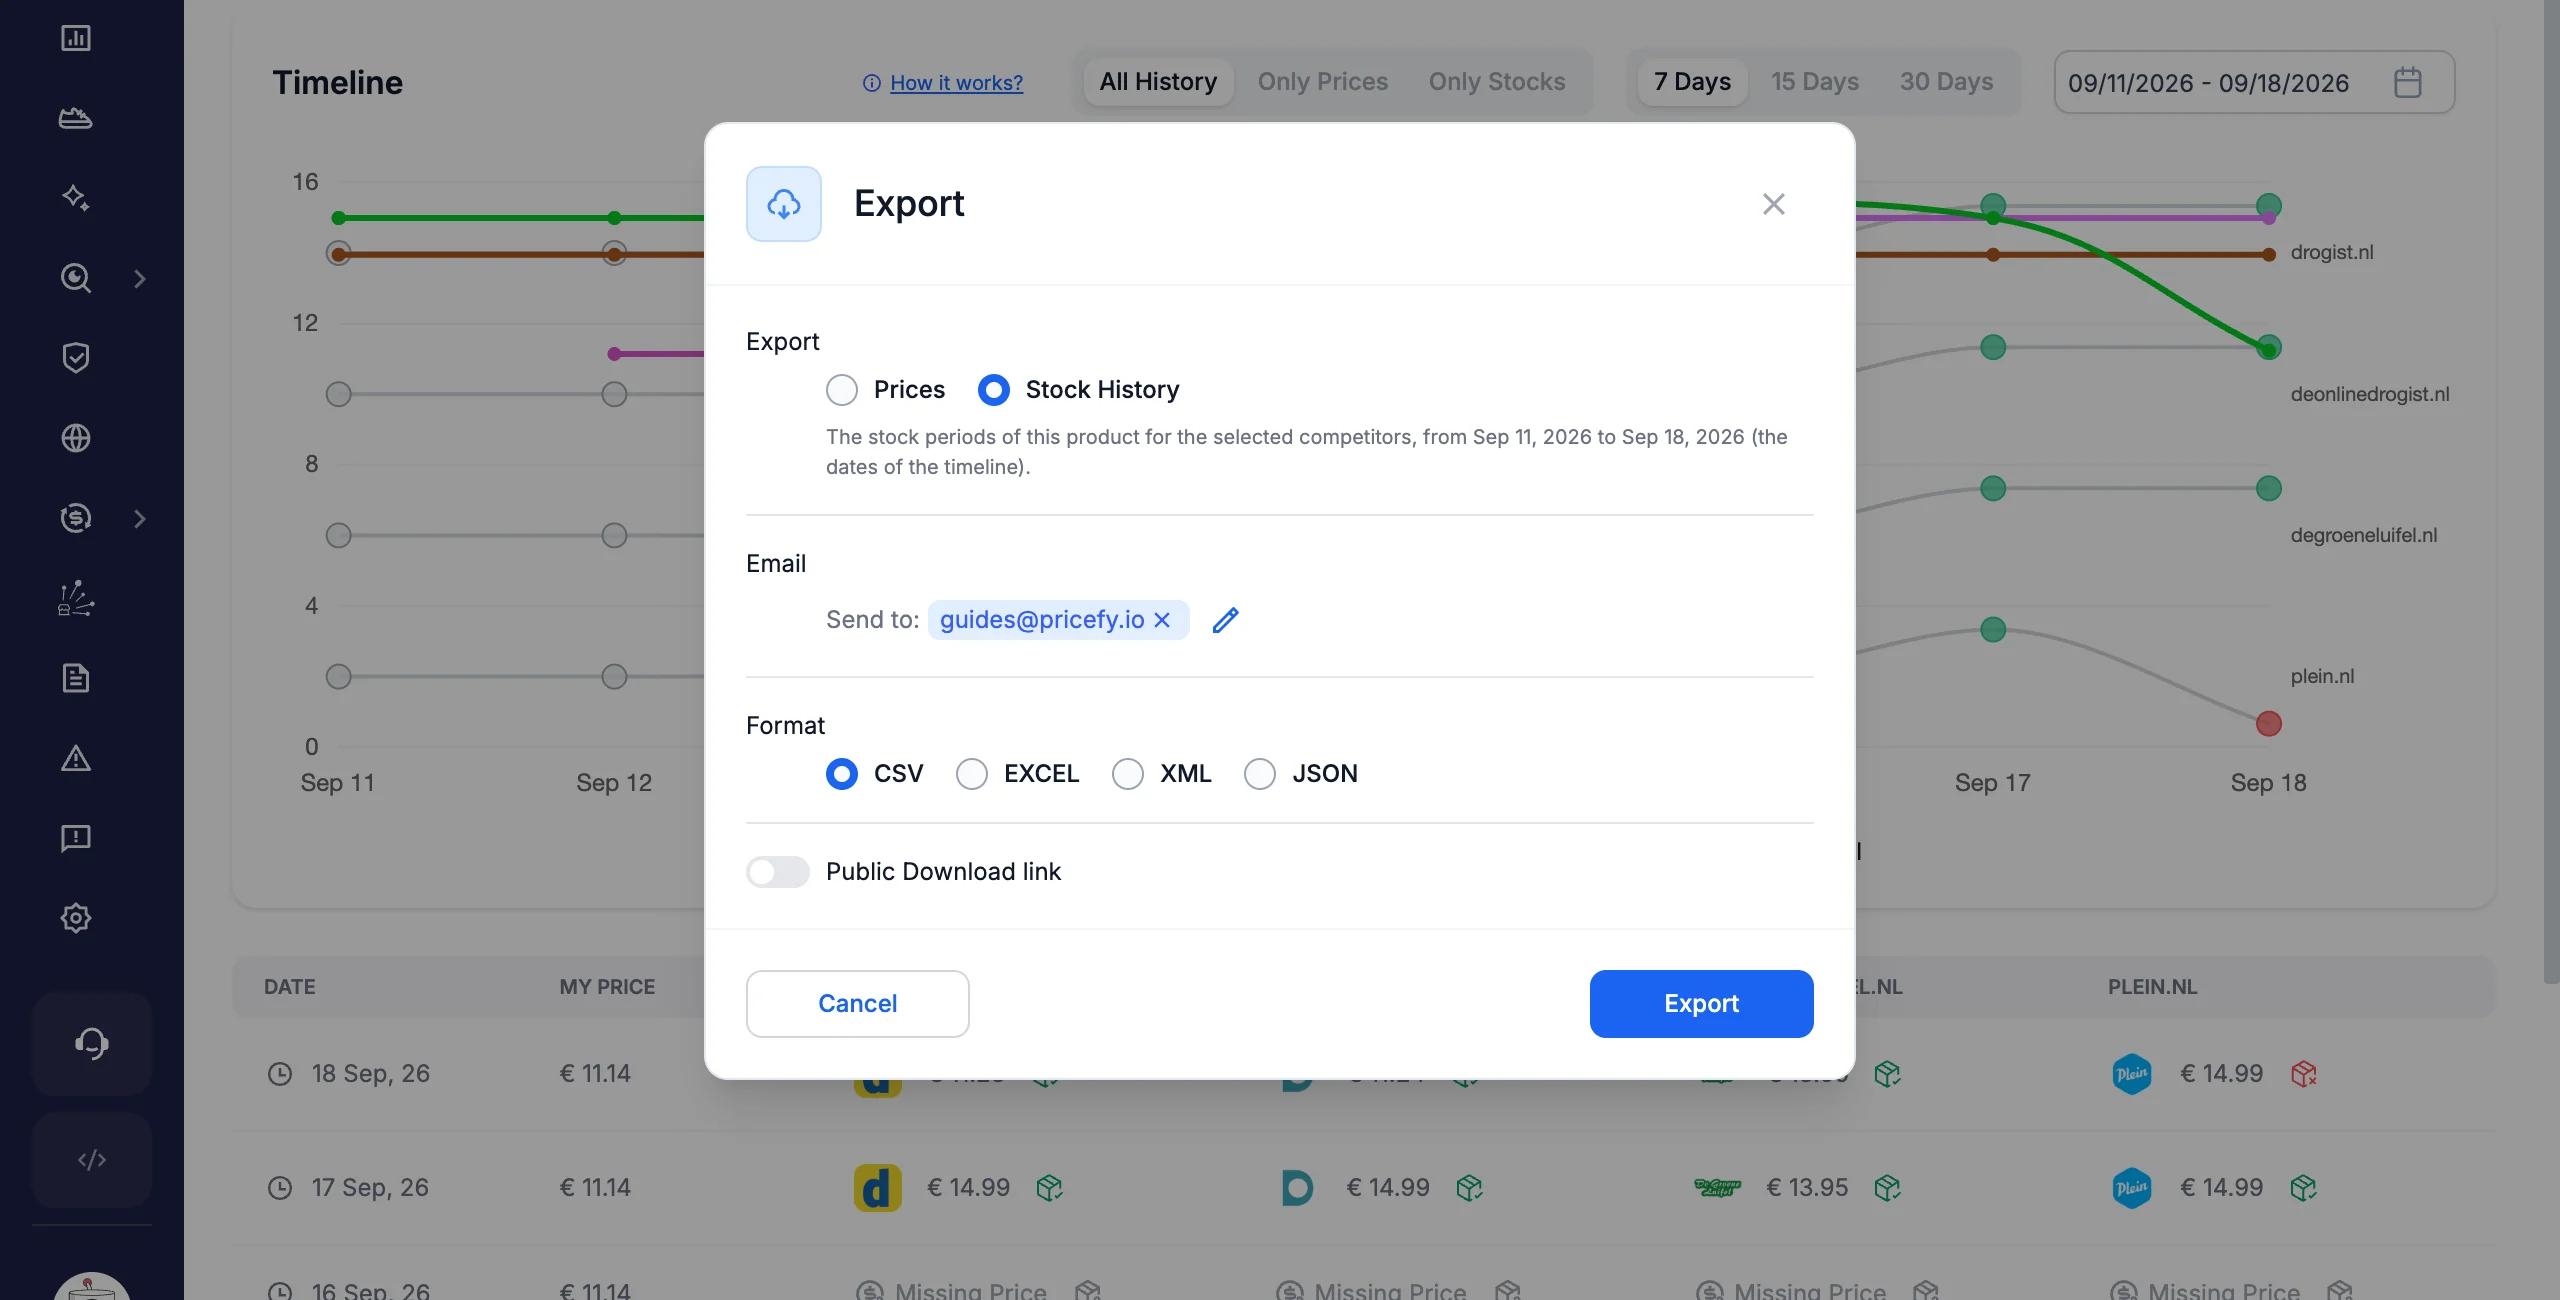
Click Export Data and choose what to export:
- Prices — the current prices of this product at the competitors on the chart, compared with yours.
- Stock History — every in stock, out of stock and page removed period of those competitors, over the dates of the timeline.
Choose the format (CSV, Excel, XML or JSON) and who receives the file by email, then click Export. Turn on Public Download link if you prefer a link you can copy. Exporting requires the Monitored URLs export permission.
Export price or stock history for many products
To download the history of all your monitored URLs — or of a filtered set — use the Monitored URLs export:
- On Competitors → Monitored URLs, apply any Filters you need — the export includes only the filtered URLs.
- Click Import & Export → Export.
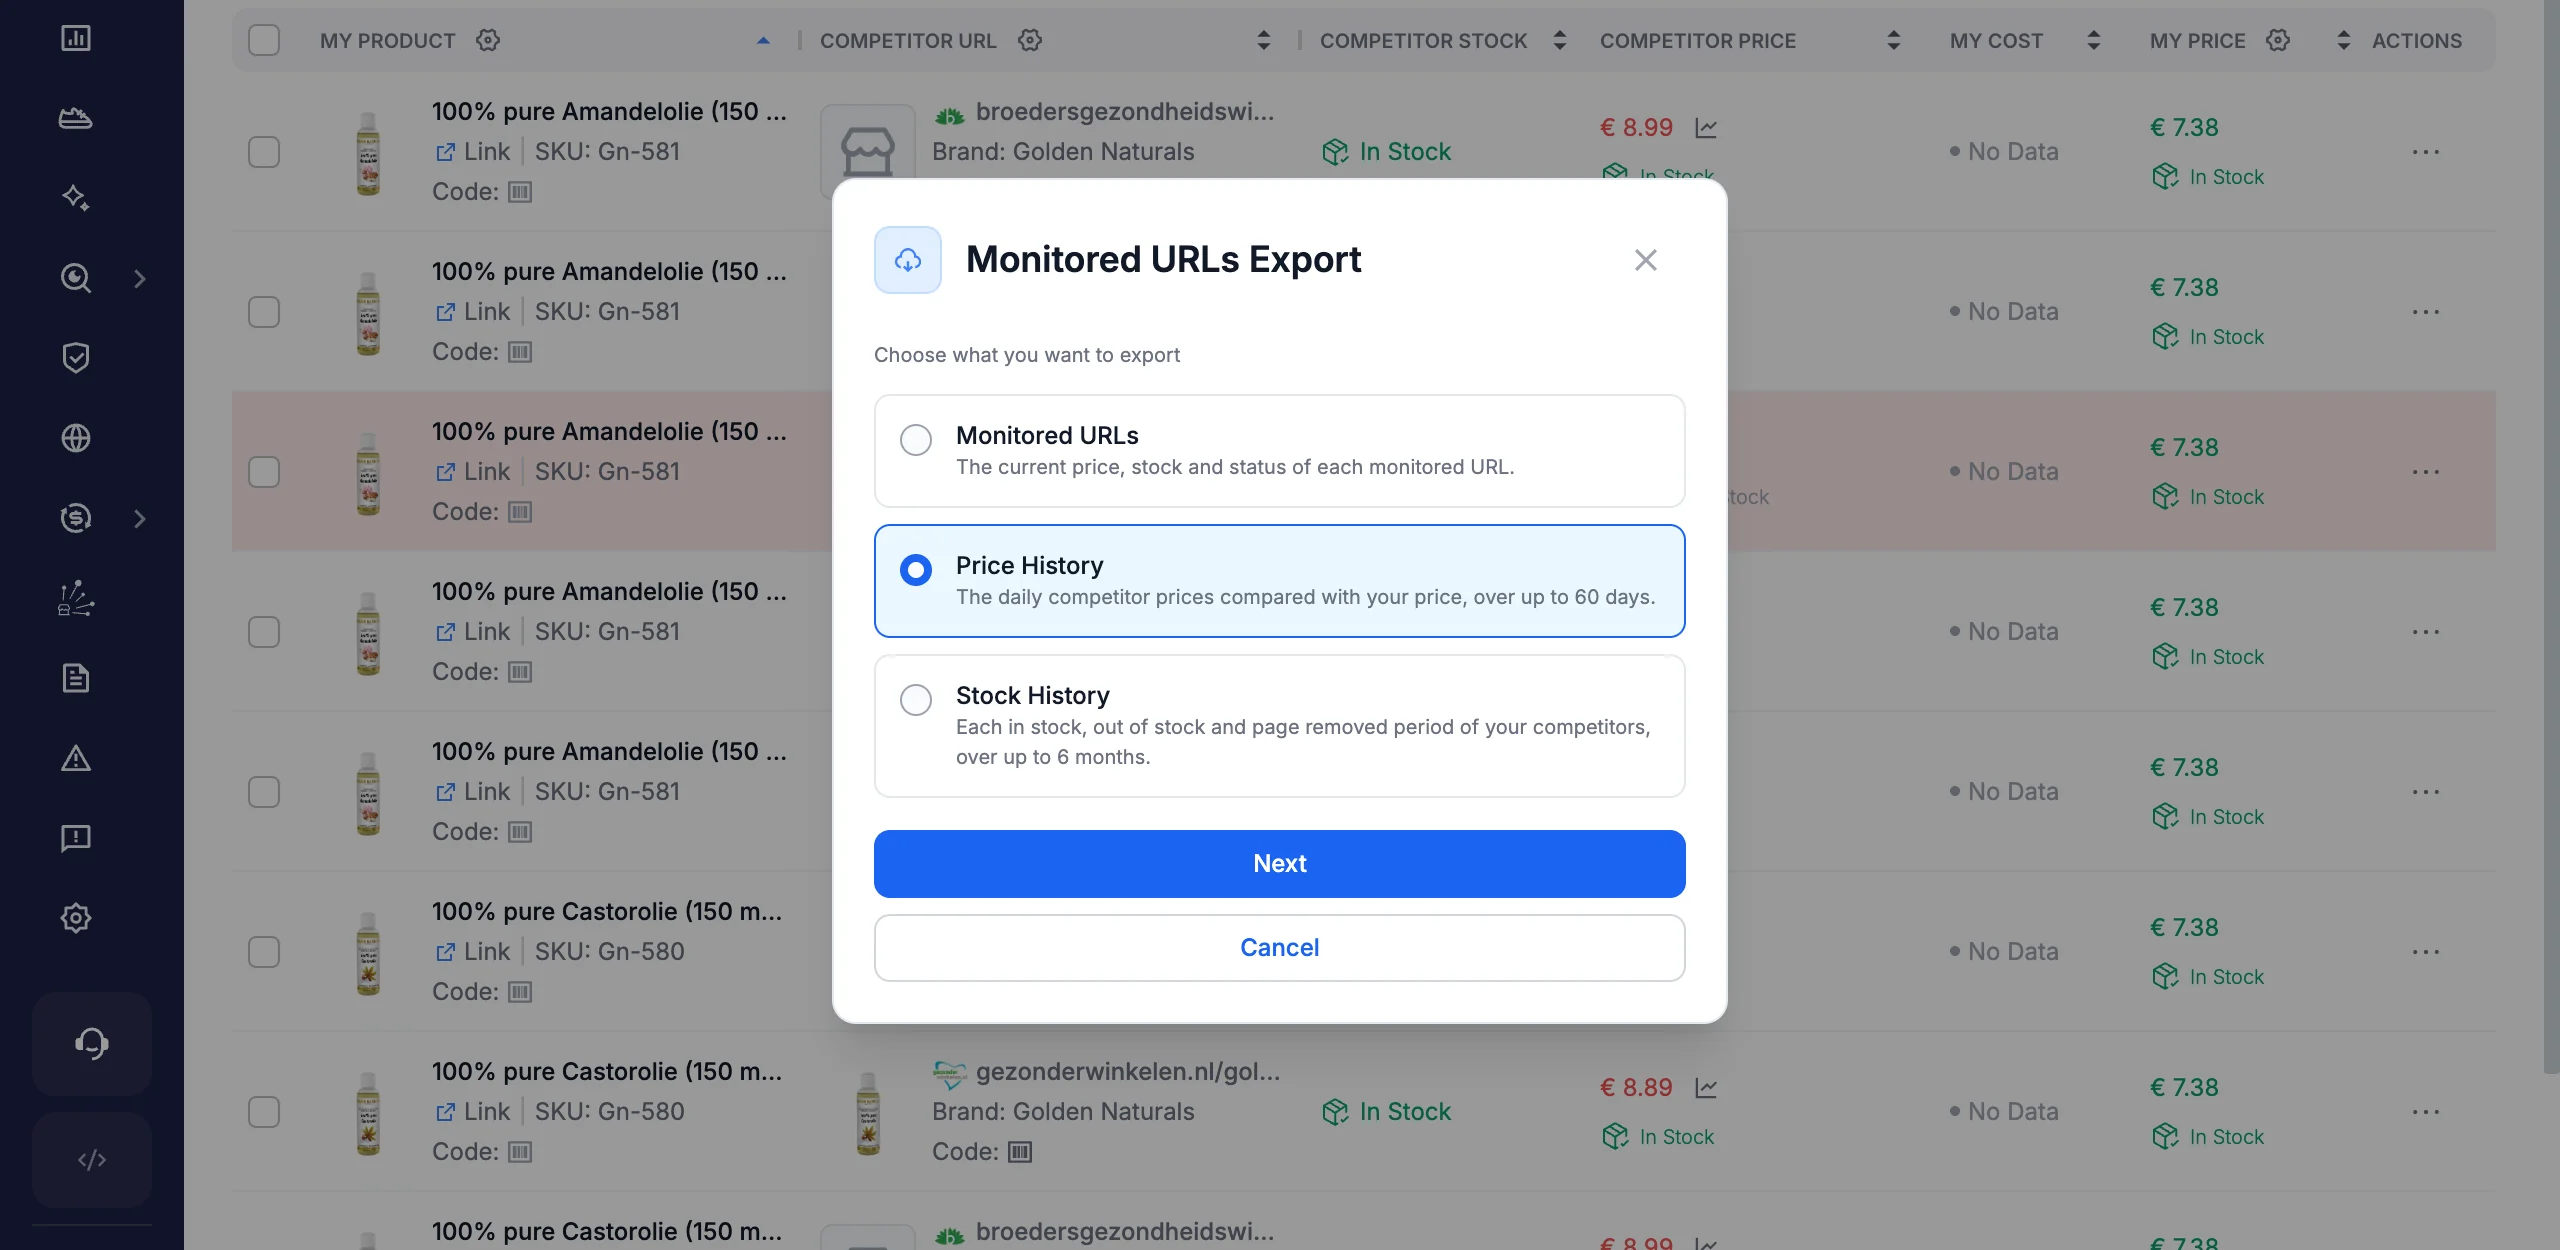
- Choose what to export, then click Next.
The three exports:
- Monitored URLs — the current price, stock and status of each monitored URL.
- Price History — the daily competitor prices compared with your price, over up to 60 days.
- Stock History — each in stock, out of stock and page removed period of your competitors, over up to 6 months.
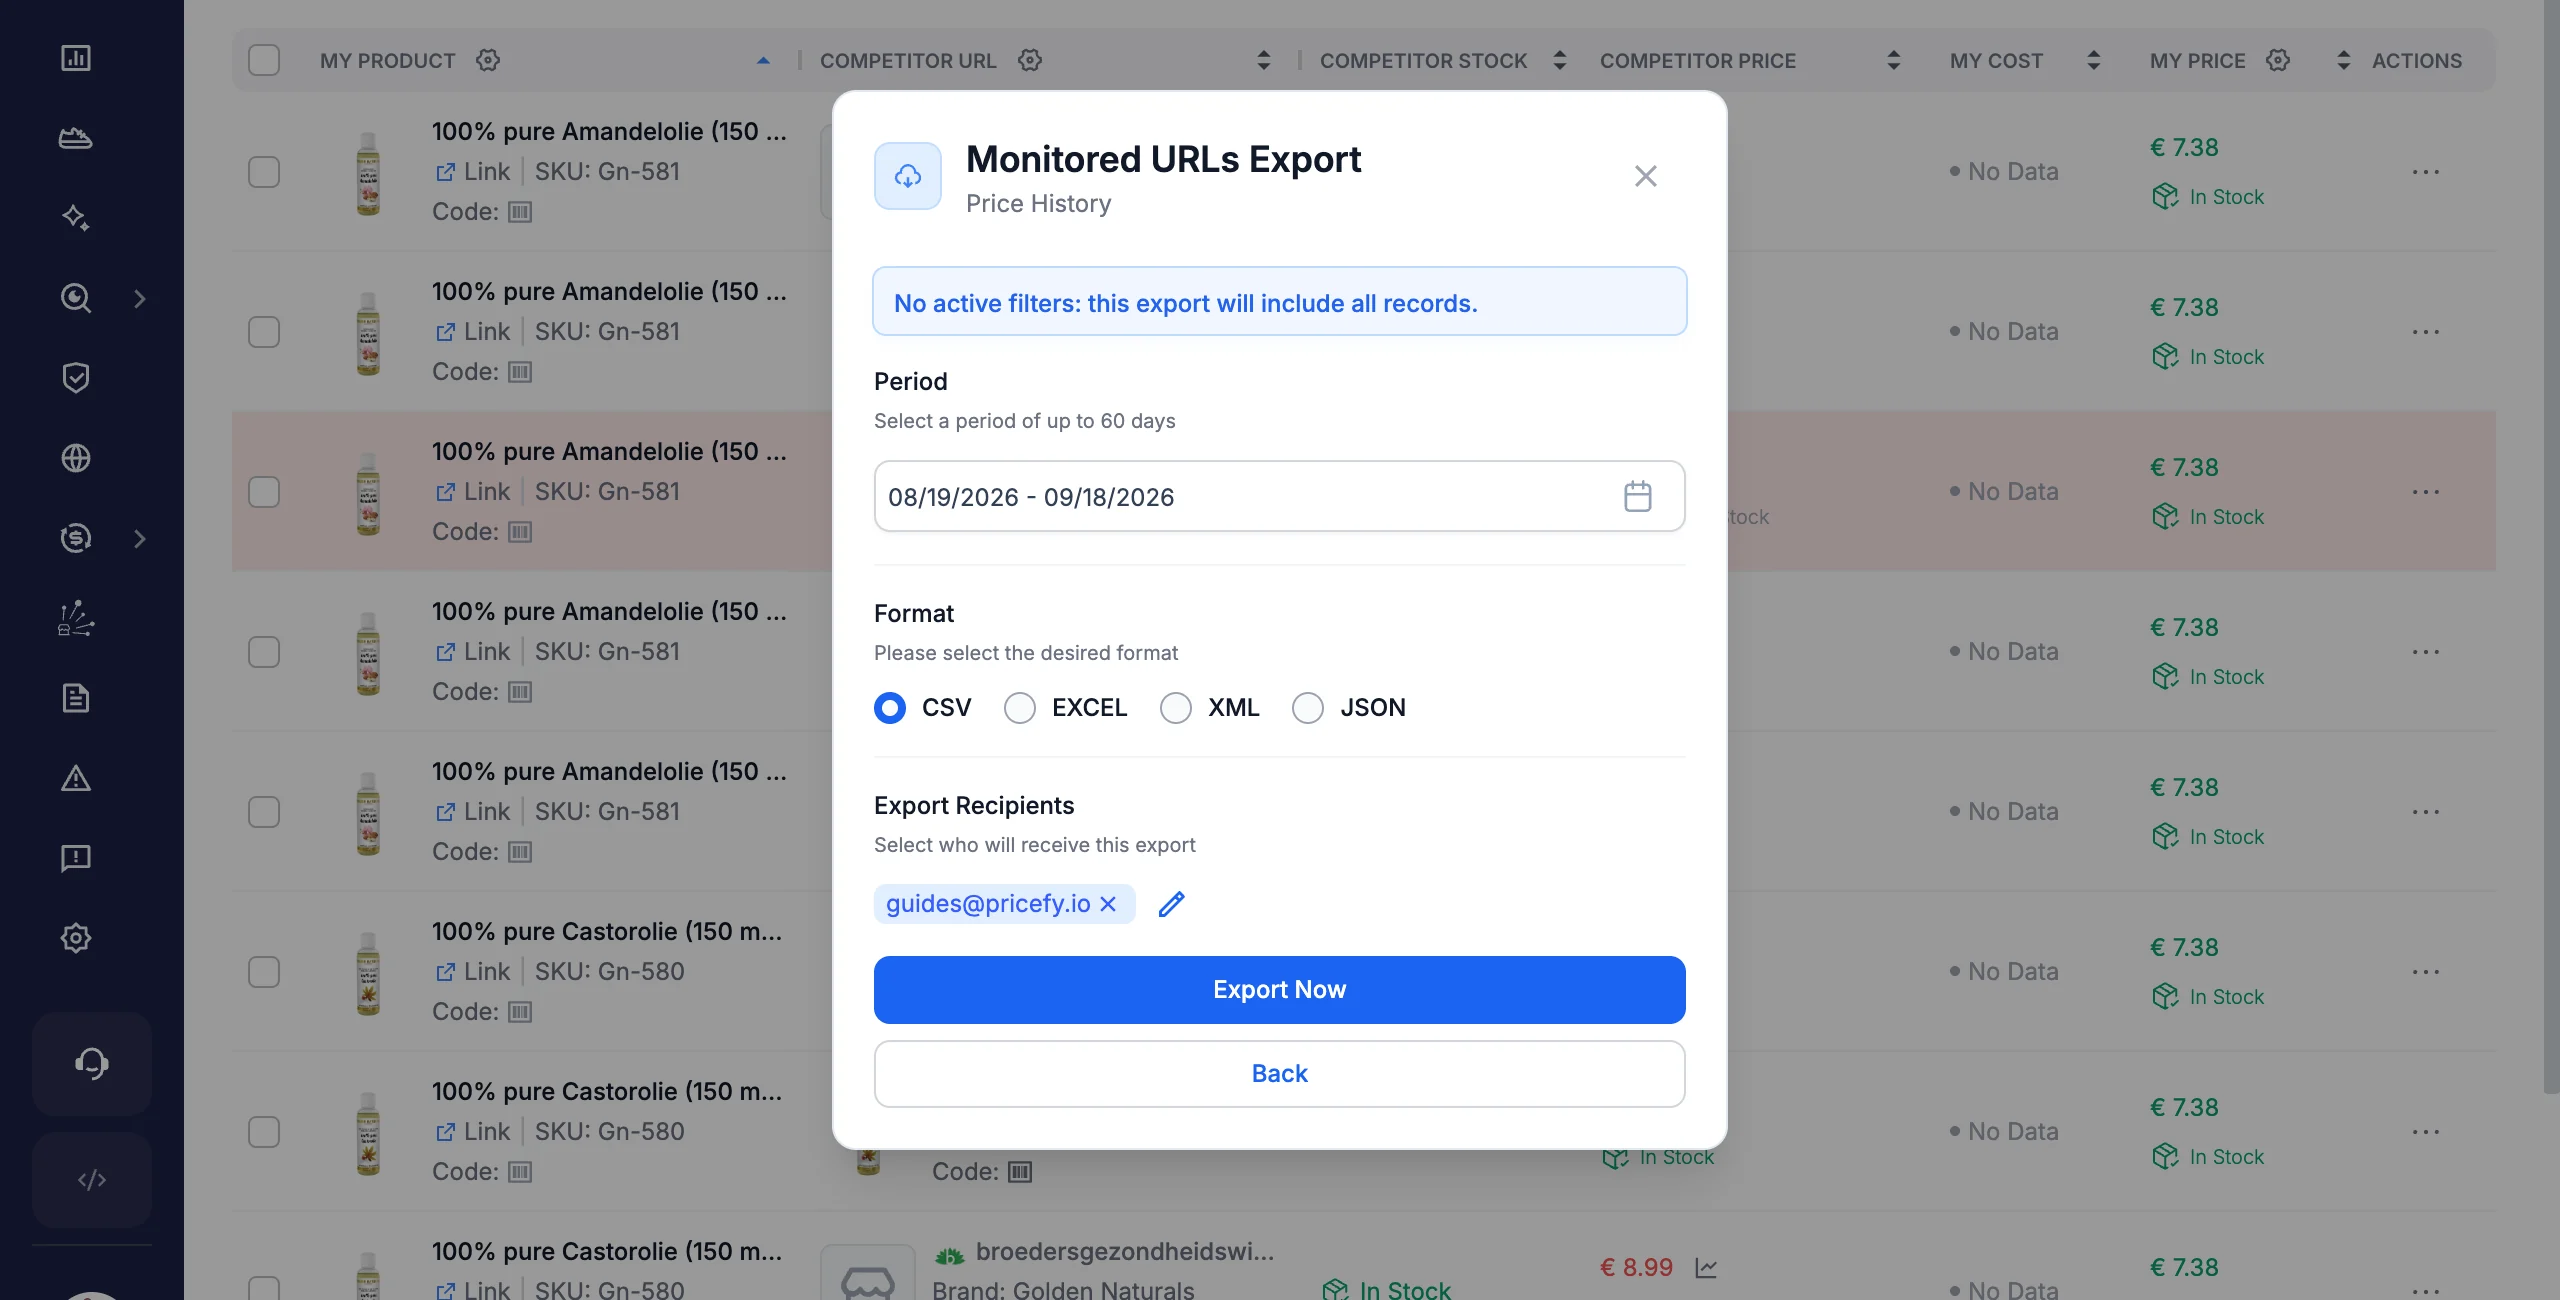
- Pick the Period, the Format and the Export Recipients, then click Export Now. The file is sent by email.
Good to know
- History is tracked per competitor URL — one of your products at one competitor. To choose which URLs you track, see How to manually monitor a competitor URL and Monitored URLs.
- Missing Price means Pricefy has no price reading for that day; the price line simply joins the days around it.
- Stock history starts when Pricefy began recording stock for a URL — earlier days show no stock data.
- Prices refresh on a schedule — see How often does Pricefy update competitor prices?.