Prefer to watch? This short video walks you through everything in this guide.
Pricefy records the price history of every competitor URL it tracks and shows it as a Price Timeline chart — so you can see how a rival’s price has moved over days and weeks, and how it compares to yours. It’s easy to miss: it lives behind a small chart icon on the Monitored URLs page.
Open a competitor’s price history
- In the sidebar, go to Competitors → Monitored URLs.
- Find the product and competitor you want. In the Competitor Price column, click the small line-chart icon next to the price — hover it and it reads View Price History.
The icon sits right next to each competitor’s price:
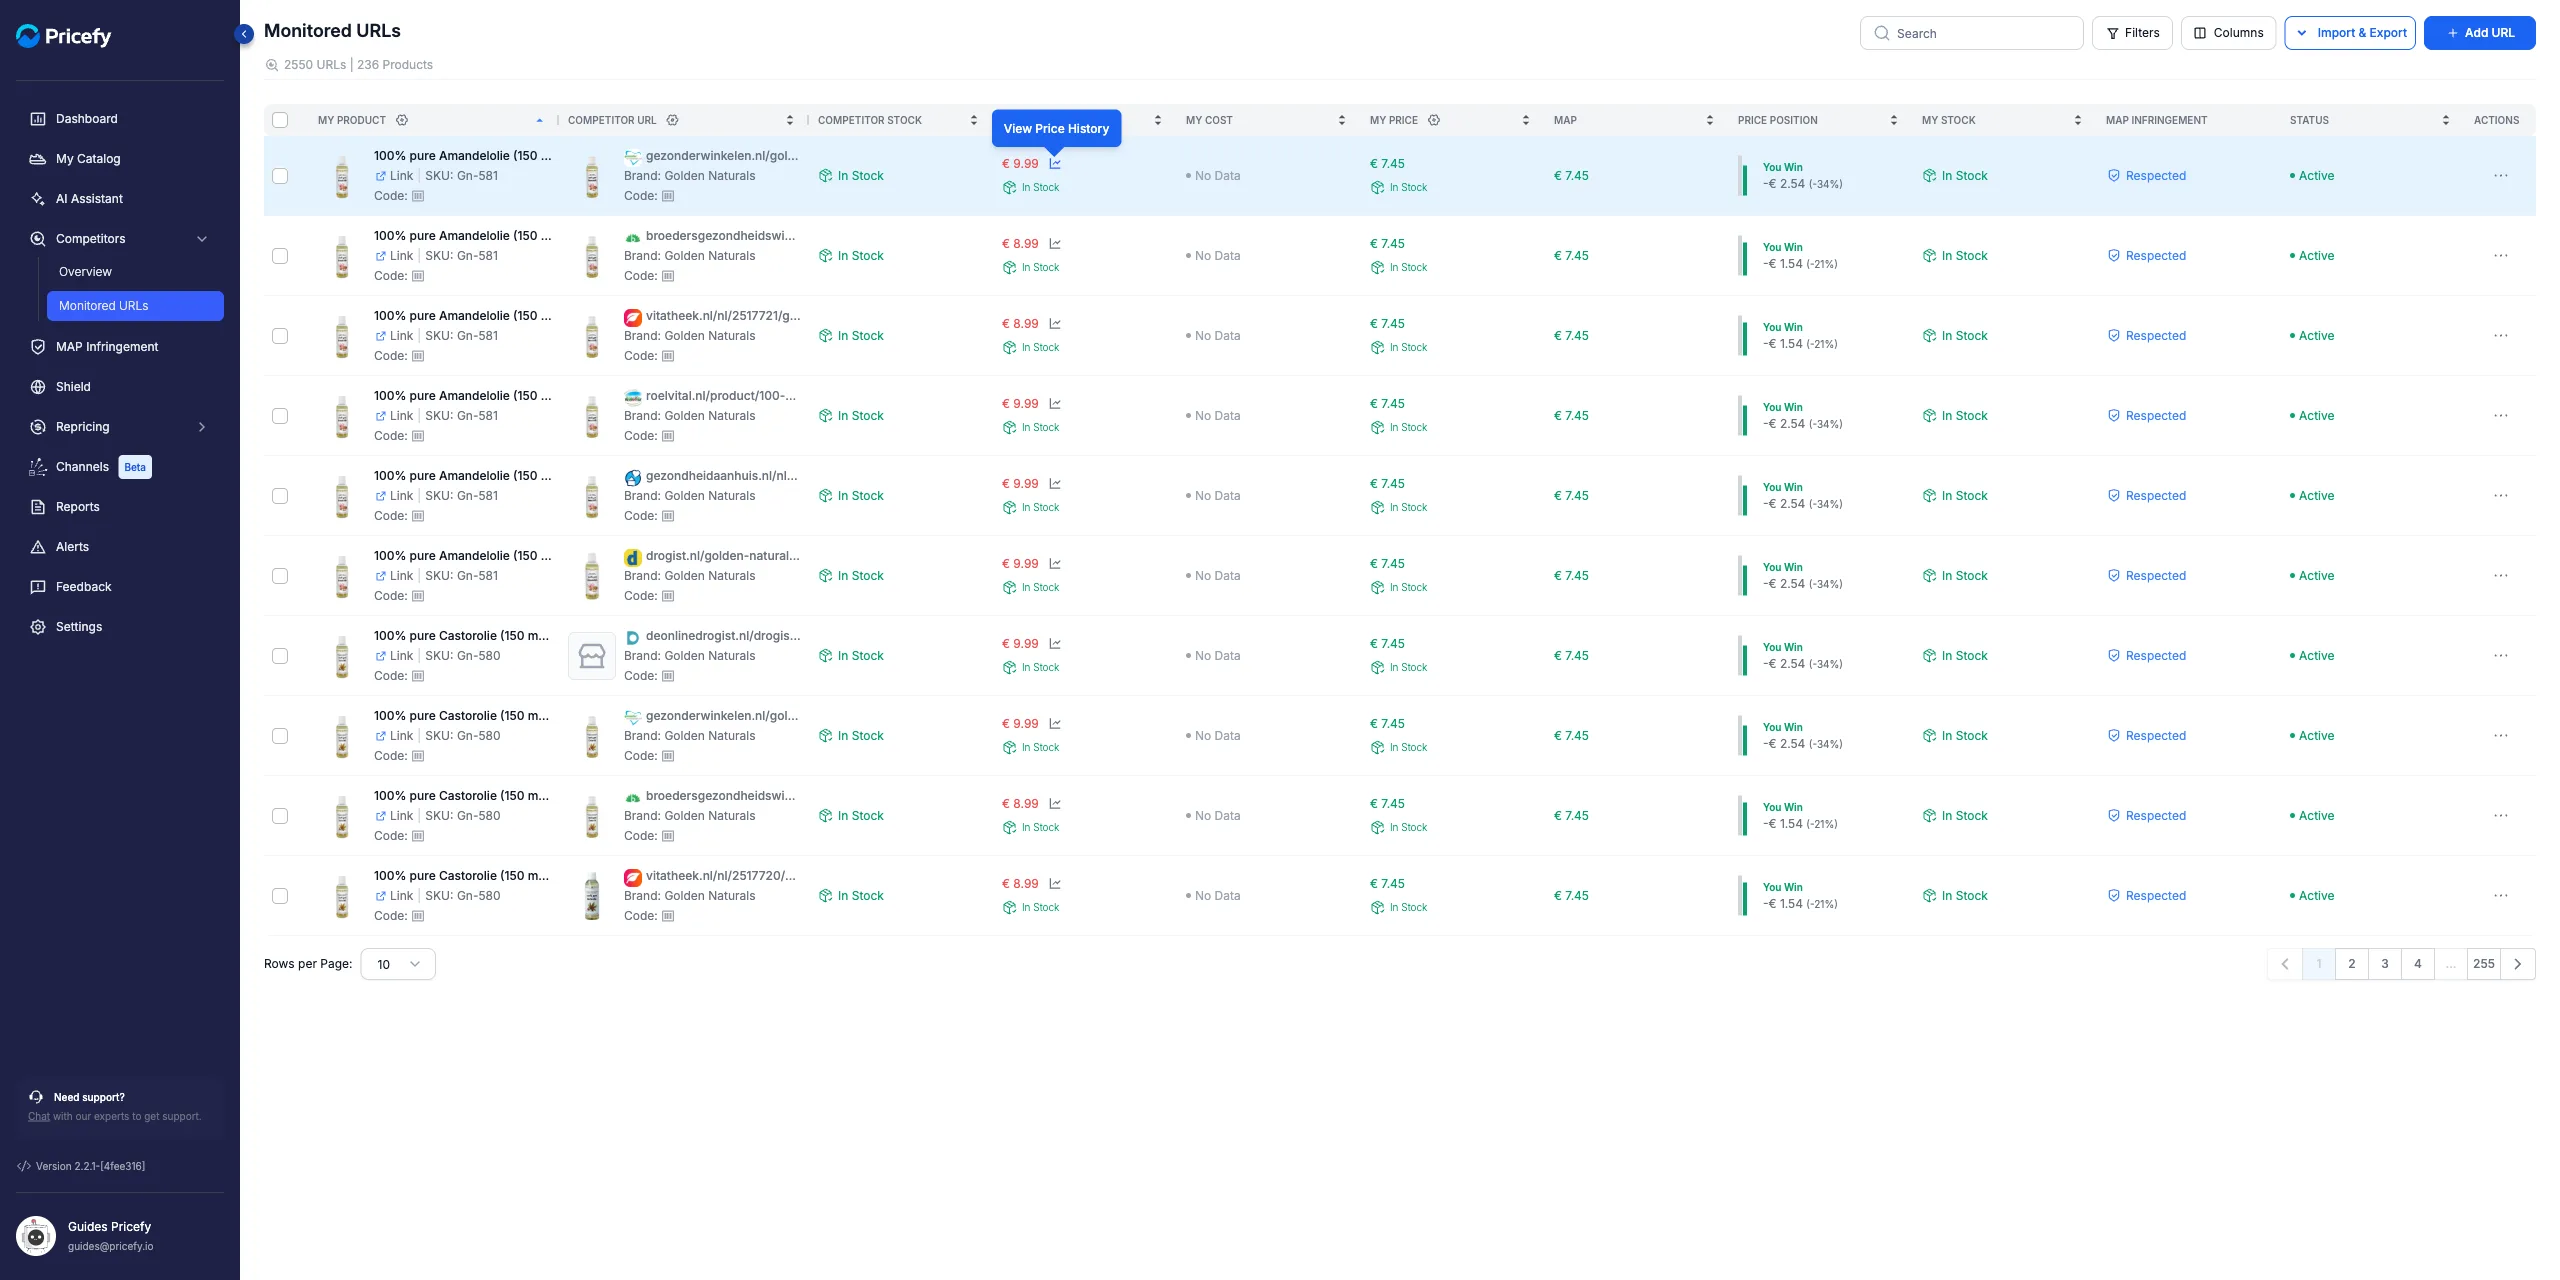
This opens the Price Timeline for that product at that competitor.
Read the Price Timeline
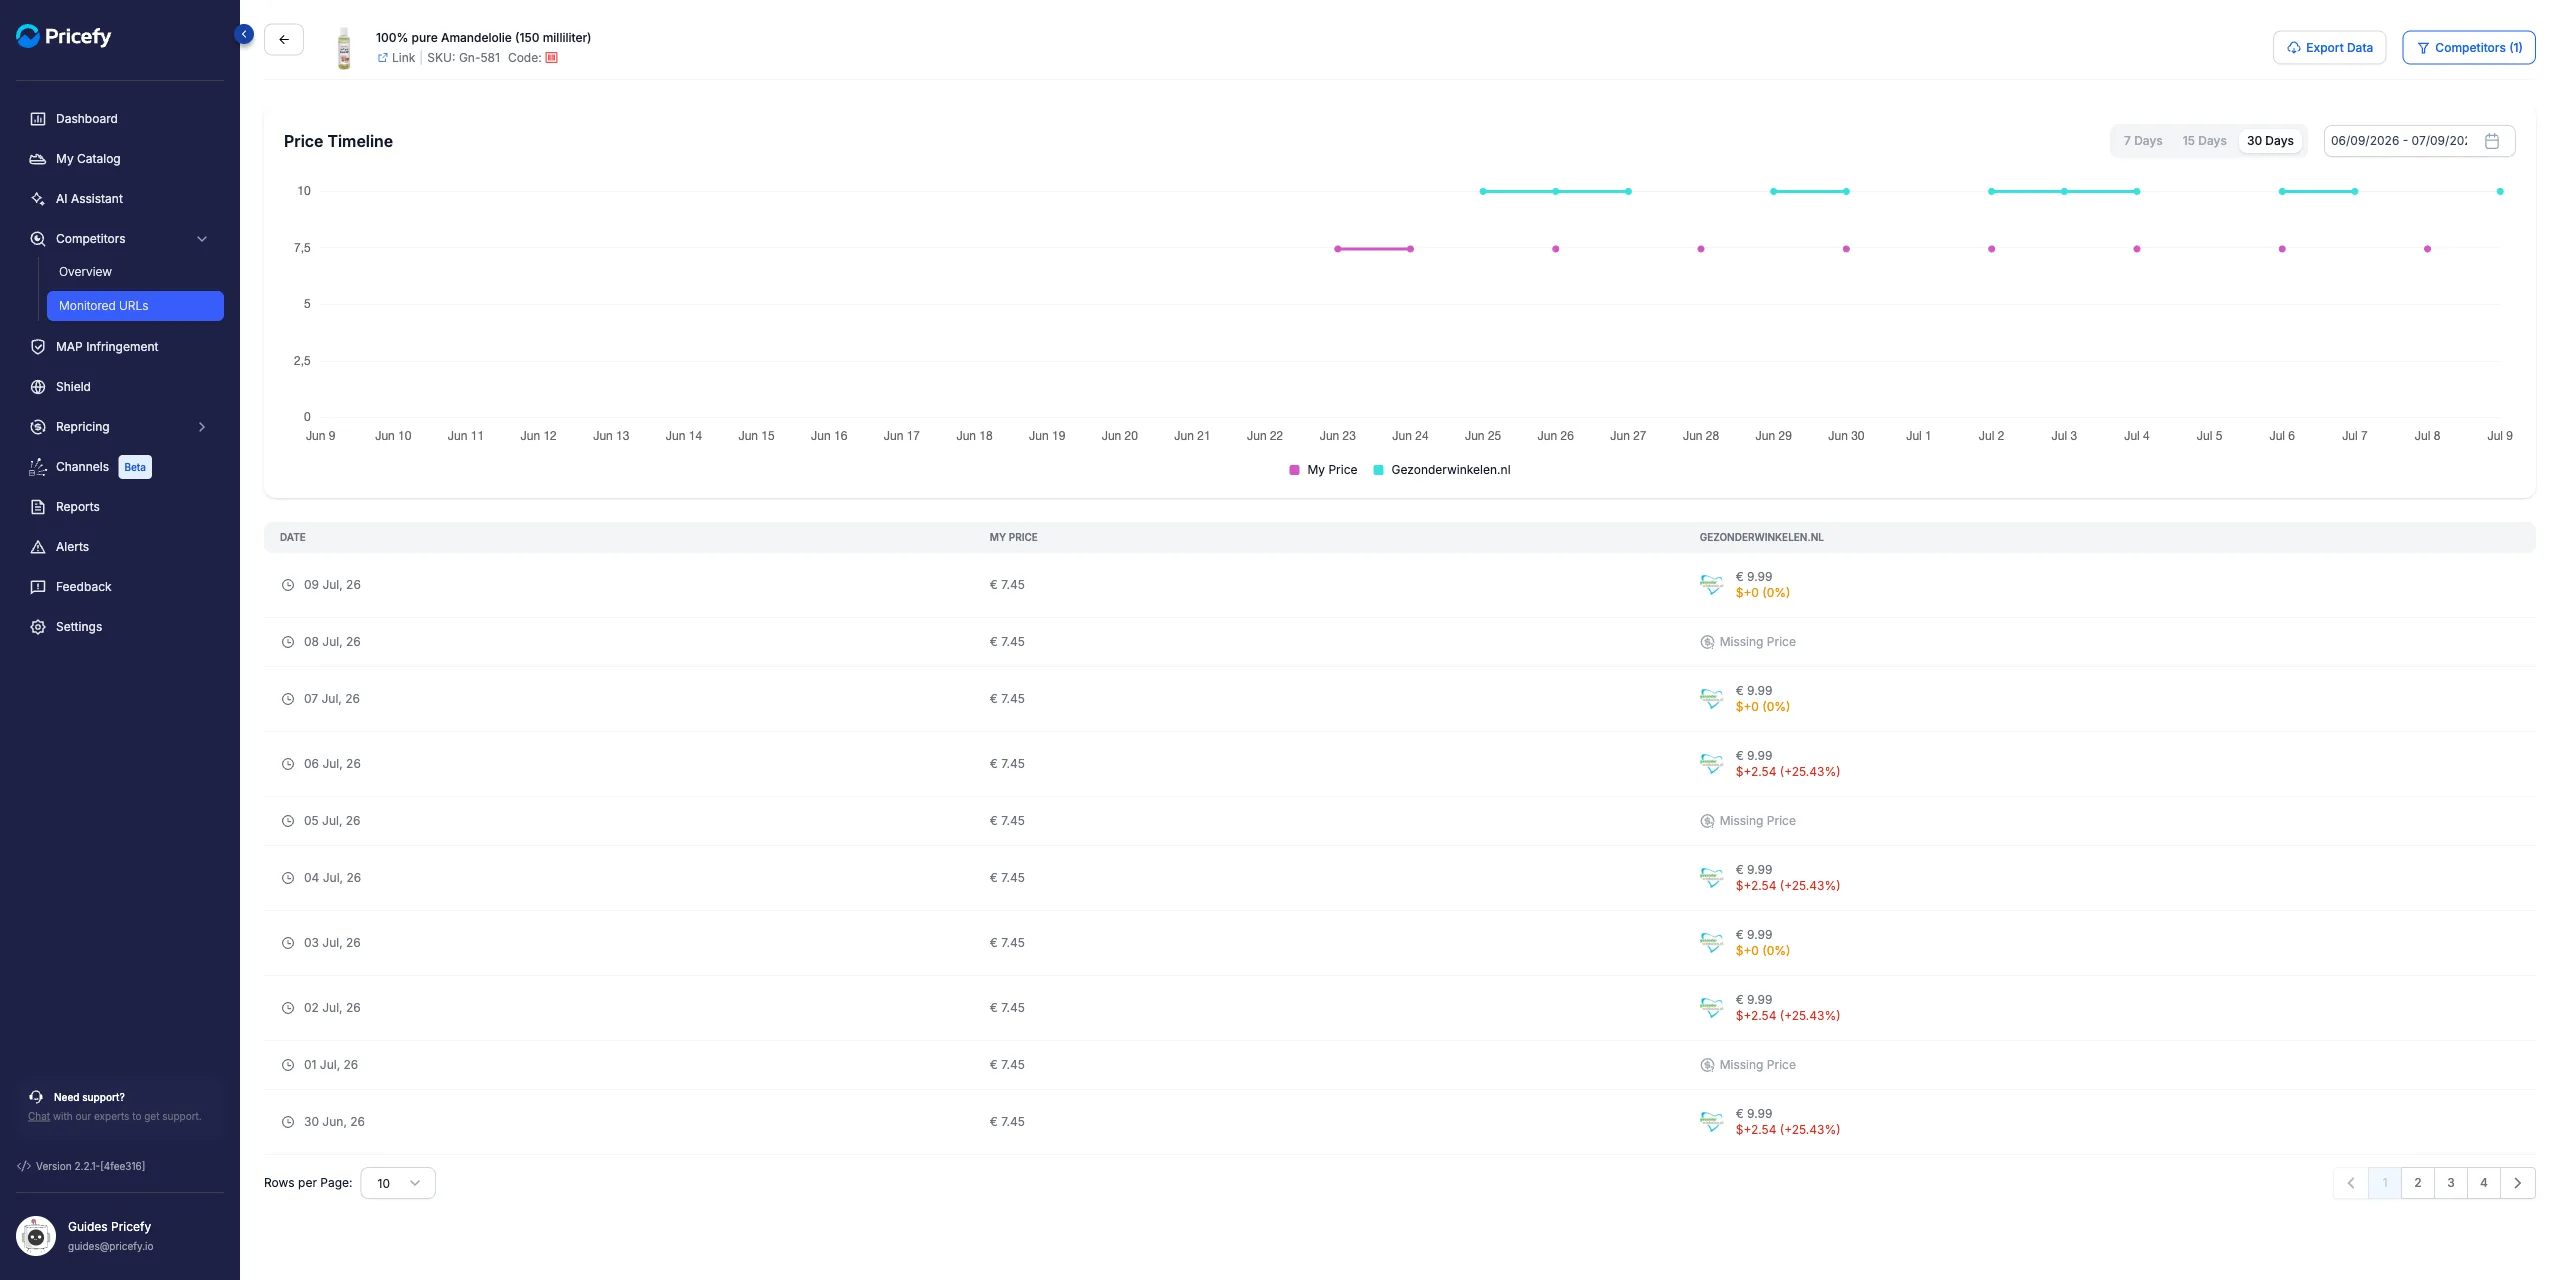
- The chart plots price by date: your price (My Price) and the competitor’s price, each as its own coloured line — the legend names them.
- Below the chart, a table lists every date with My Price, the competitor’s price, and how much higher or lower it was than yours (with the percentage). Days with no reading show Missing Price.
Your price and the competitor’s, tracked day by day:
Change the time range
Pick how far back to look:
- Use the 7 Days / 15 Days / 30 Days toggle for quick ranges.
- Or choose a custom range with the date picker (up to about six months at a time).
Compare several competitors on one chart
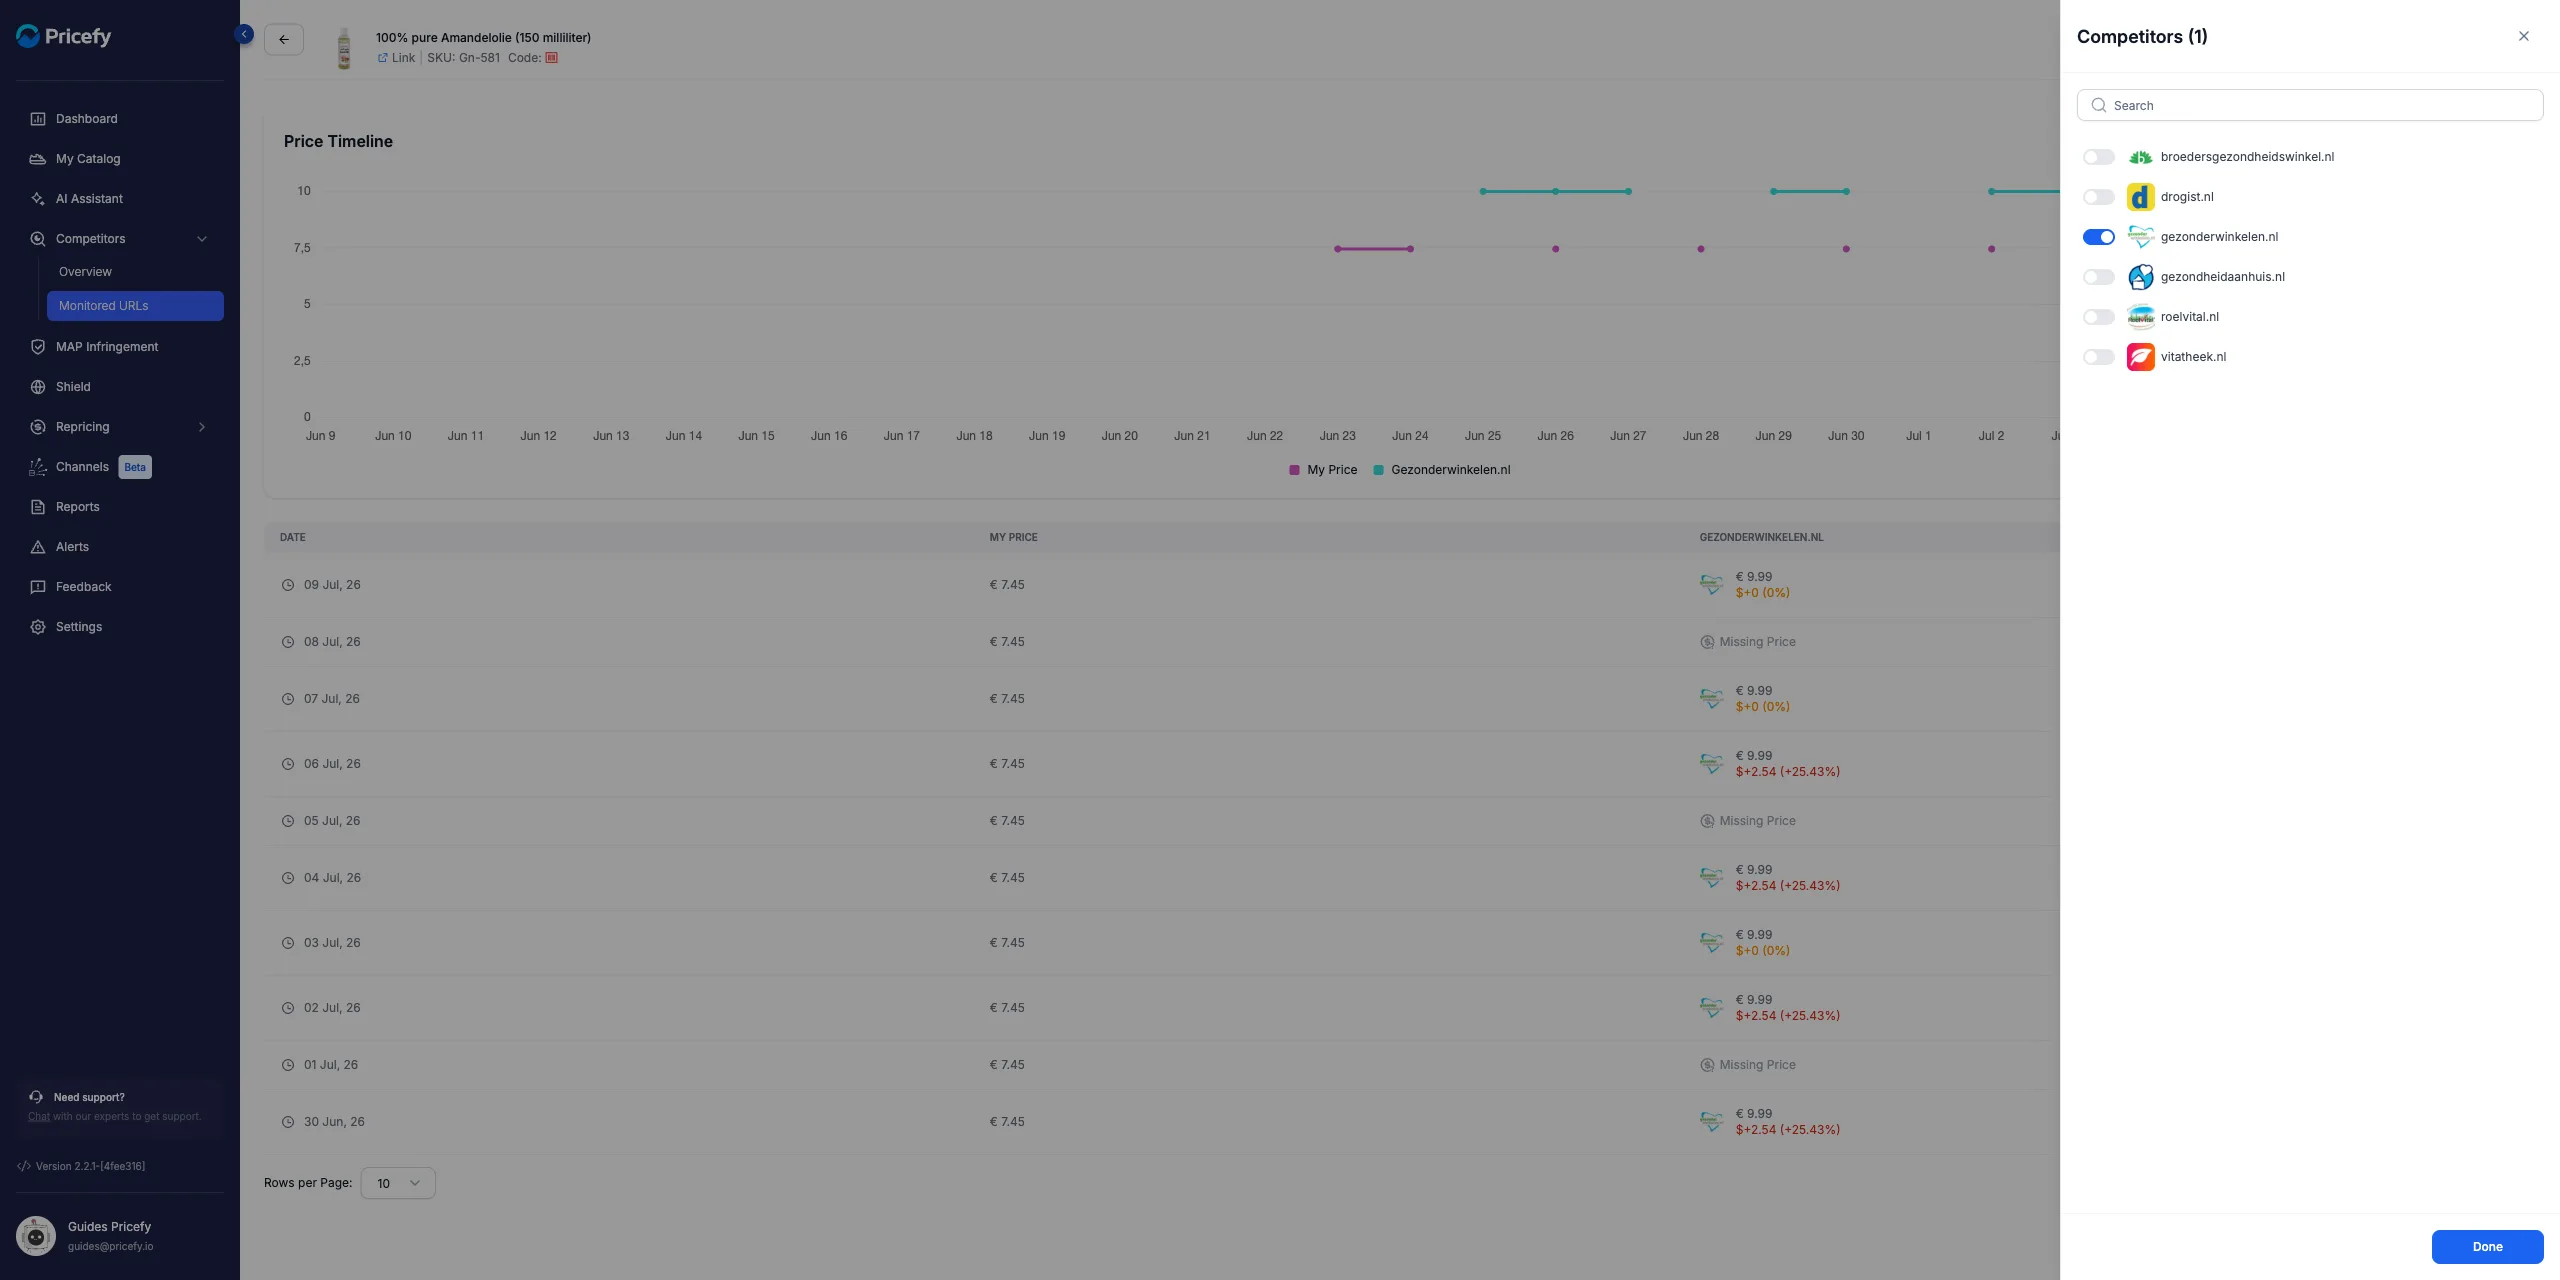
- Click Competitors (N) at the top right — it lists the competitors that track this product.
- Toggle on the ones you want to see, then click Done.
Each competitor is drawn as its own line, so you can compare rivals side by side on the same timeline:
Export the history
Click Export Data to download the Price Timeline for this product (requires the Monitored URLs export permission).
Good to know
- Price history is tracked per competitor URL — one of your products at one competitor. To choose which URLs you track, see Monitored URLs.
- Missing Price means Pricefy has no price reading for that day, so that point is left off the line.
- Prices refresh on a schedule — see How often does Pricefy update competitor prices?.